I have the following question in a recent survey: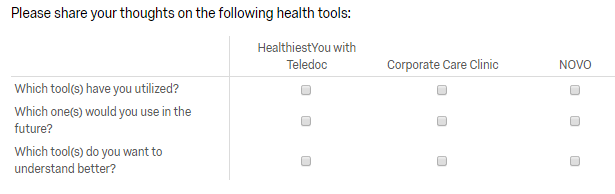 The column headers are coming over as 1, 2, 3 - How do i change it to read the actual titles?
Also, what is the best widget/way to show the results in a dashboard for a matrix question(s)?

How to translate a matrix question into a widget?
 +1
+1

 +1
+1
In your survey editor, you can click the settings gear next to the question and select "Recode Values" to make sure the column headers are correct. Then in your dashboard settings, you can recode the question so that the column numbers recode to the header labels. See attached.
As far as the best widget, you may have better luck creating some embedded data fields in the survey flow to help you out with calculations. For example, create a field called "NOVO_Utilized" which is set to a 1 or 0 depending on if they checked it or not. Then you can create 9 Numeric Value variables in your dashboard settings, which will let you use a bunch of different widgets. For example, use a Gauge chart to display the average of NOVO_Utilized, set it to percentage, and you will see a percentage of how often that response was checked.
EDIT: I did the classic blunder of not attaching the image the first time. In this image, column 1's header is "sp1", column 2's is "sp2", column 3's is "sp3". Here they are just recoded to sp1, sp2, and sp3, but you can change to numbers.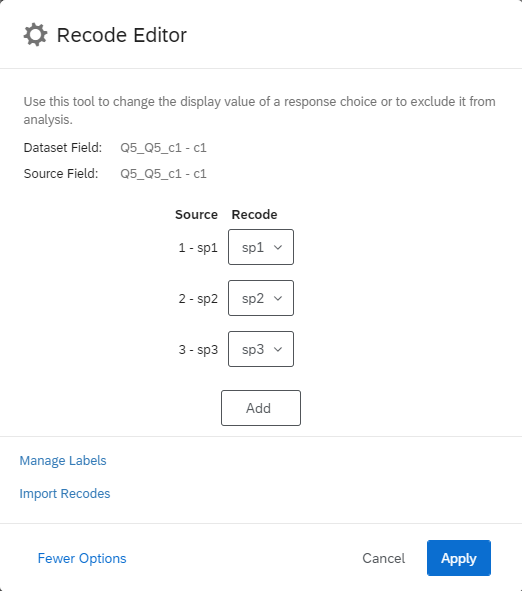


Hi Joelle_Winter! If you have not yet already, I’d recommend reviewing this support page on Matrix Statements in a Single Widget to help you get started. If you still have questions after reviewing the linked support page, you'll want to reach out to the Support team, as they are best equipped to help answer questions and provide support! :)
Leave a Reply
Enter your username or e-mail address. We'll send you an e-mail with instructions to reset your password.