We are providing a widget to include response rate out of number invites, There is historical data imported as well. Client is looking for response rate for all waves in one table (provided number if invites from historical data). And we do not have access to benchmark in our license hence we used Custom metrics for each wave to calculate response rate. However we are unable to use this metrics in single table showing waves rows.
Could anyone let us know have any idea or had this kind of request earlier?

How to include Response rate in Survey Dashboard for multiple waves in single "simple table"?


Have you tried using a pivot table instead of simple table? There is a little more control over how you can arrange things.
This sounds like something I have encountered before. The waves may need to be columns and make response rate the rows instead. It sounds like you want it the other way around but since the response rates are custom metrics I think they will need to be rows.
You can see what I did in a pivot table below (ignore the count metric), and instead of date make the column dimension wave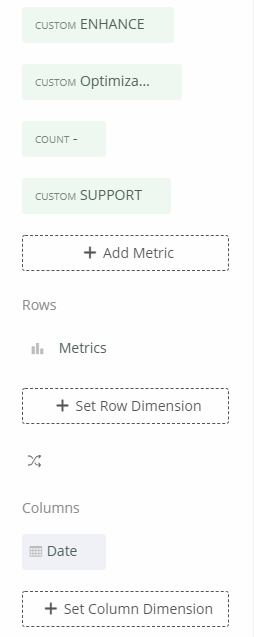
Leave a Reply
Enter your username or e-mail address. We'll send you an e-mail with instructions to reset your password.