
Is it possible to somehow get the information, which number the participant chose instead only receiving passiver, promoter or detraktor in the excel sheet. Thanks.
Best answer by lizb311
View original
Is it possible to somehow get the information, which number the participant chose instead only receiving passiver, promoter or detraktor in the excel sheet. Thanks.
Best answer by lizb311
View original
 +19
+19
Yes, this is possible - and should happen automatically when you download your data in Excel. If you download your data, you should see two columns for your net promoter score question. One will be the group (detractor/passive/promoter), and will be called something like Q1_NPS_Group. The following column immediately after that should be the raw score (on a scale from 0 to 10) and will be called something like Q1 (again, depending on what the question number is in your particular survey).
To get the 0-10 numbers to display as a chart in your reports:
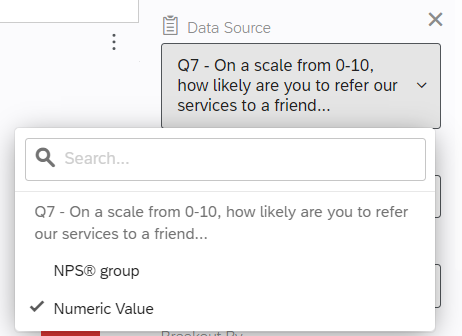 Change the visualization type to a bar chart (or table or whatever you like).
thank you !
Hi!
When exporting the data to CSV, is it possible to only export the 0-10 value and not the "promoter, detractor" categories?
Thanks!
Enter your username or e-mail address. We'll send you an e-mail with instructions to reset your password.
