Hi Experts,
We have launched the Employee Engagement survey in 2020 and we are launching for 2021. And we wanted to do a comparison of the results with the last year data and new year in the dashboard.
Please suggest how to do the same.
Thank you,
Krishna

Year on Year Comparison results
 +1
+1

Userlevel 3
 +3
+3
KrishnaPrabhu you have to map the 2020 EE survey as a data source on the backend of the 2021 EE and map all the relevant fields, then add comparisons under the Comparisons tab of dashboard settings and you will be able to easily compare results on Scorecard, Heatmap widgets and more etc.
+1
Our case is to display the differences between both the data. Base value with + or -.
Userlevel 3
+3
KrishnaPrabhu yes it is possible after you map the data set source for 2020 you can add comparisons on the backend say 2020 Current Selection and then report on the scorecard widget by adding those comparisons, you can report on the % favourable or +/- delta values too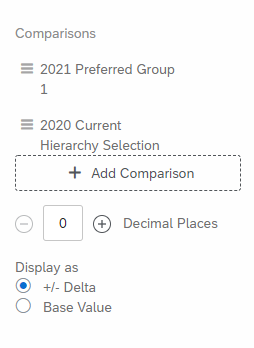

Userlevel 2
 +15
+15
We would like to see Y-Y comparisons within the heatmap widget, rather than having to look at question by question comparisons. Power BI has this feature so every time we run our Annual Engagement Survey we have to build a Qualtrics AND PBI dashboard to cover the Y-Y visual.

Userlevel 7
+56
KrishnaPrabhu, this may come a bit late but this screenshot shows how you can create a year-on-year widget in Vocalize. Ana_Louise I'm very intrigued by how one might build a heatmap to show changes in engagement. I could see how this would work in Tableau as well, creating a heatmap and animating using the date field!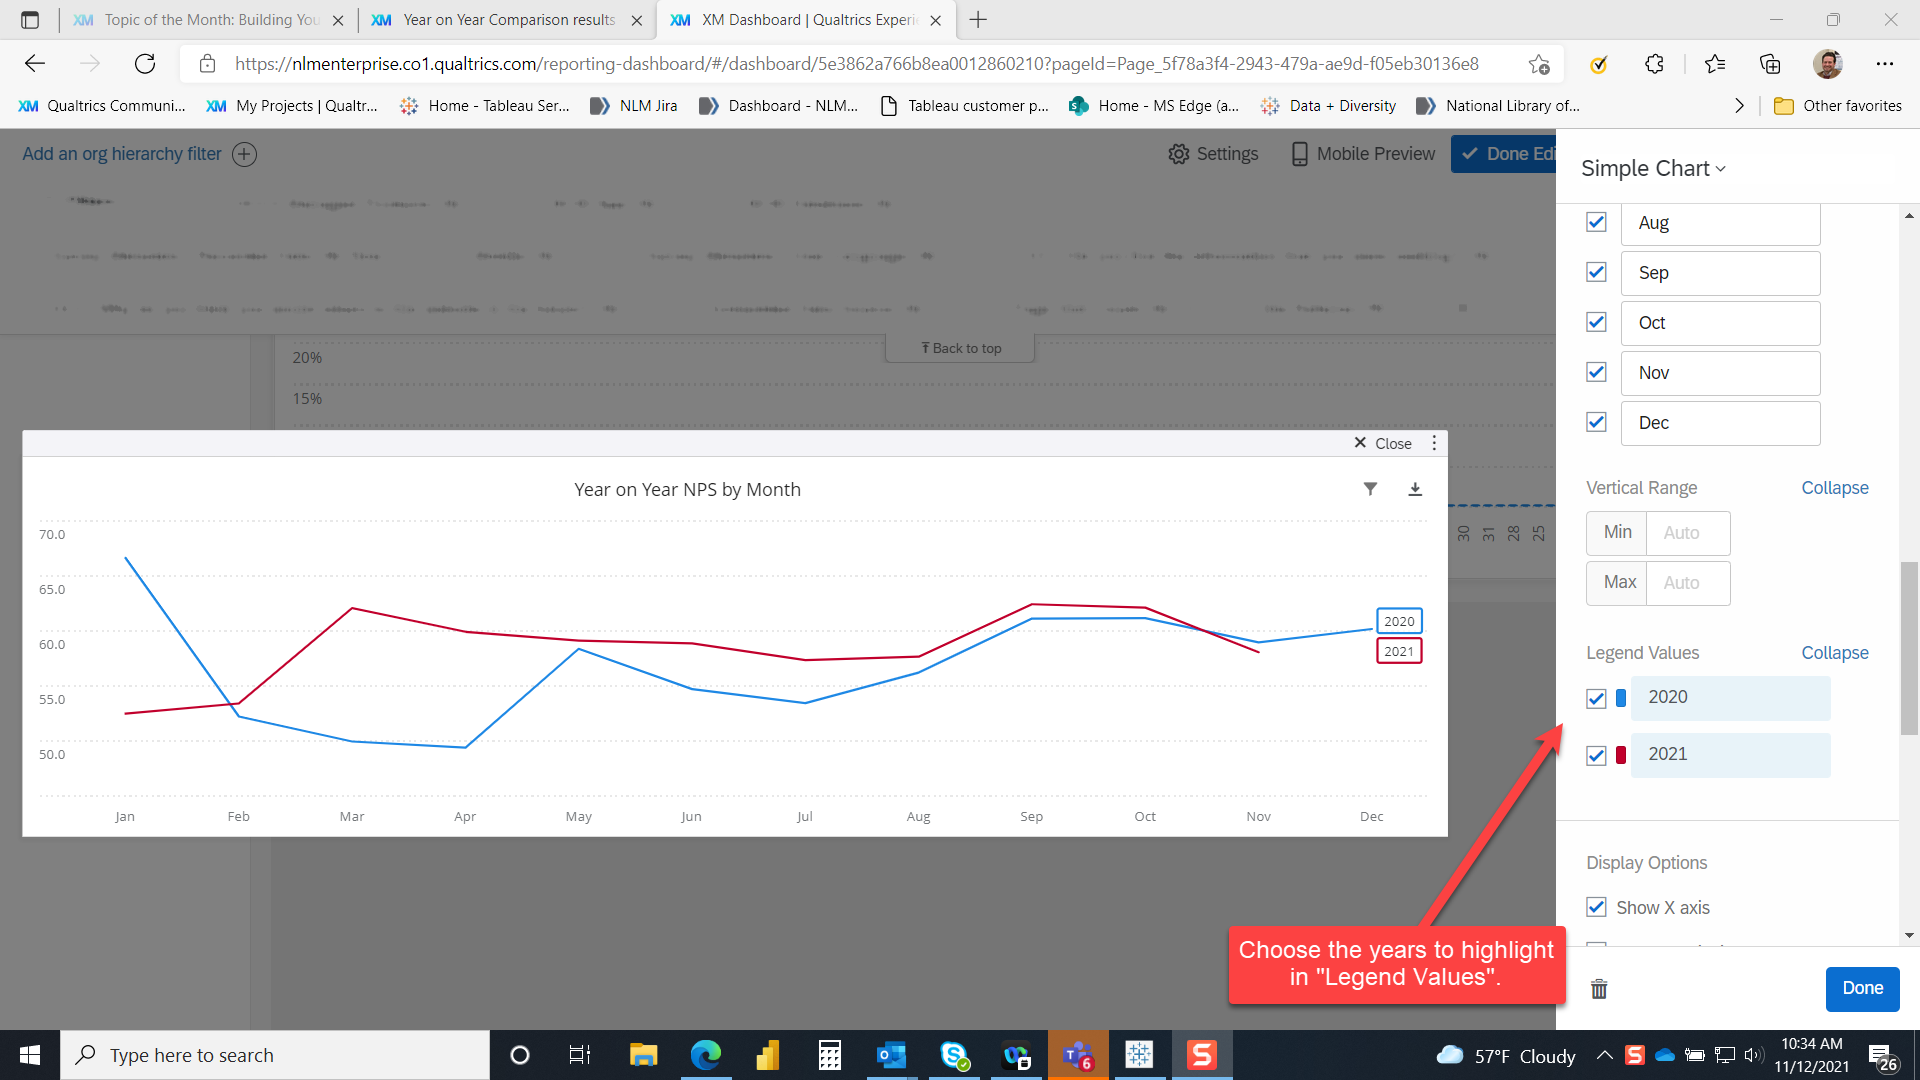
Leave a Reply
Enter your username or e-mail address. We'll send you an e-mail with instructions to reset your password.