


I have two surveys that are the same but were conducted three years apart, and I would like to compare the results in a dashboard. I have added the two data sources in the Dashboard Data section, and lined up the matching questions (see below).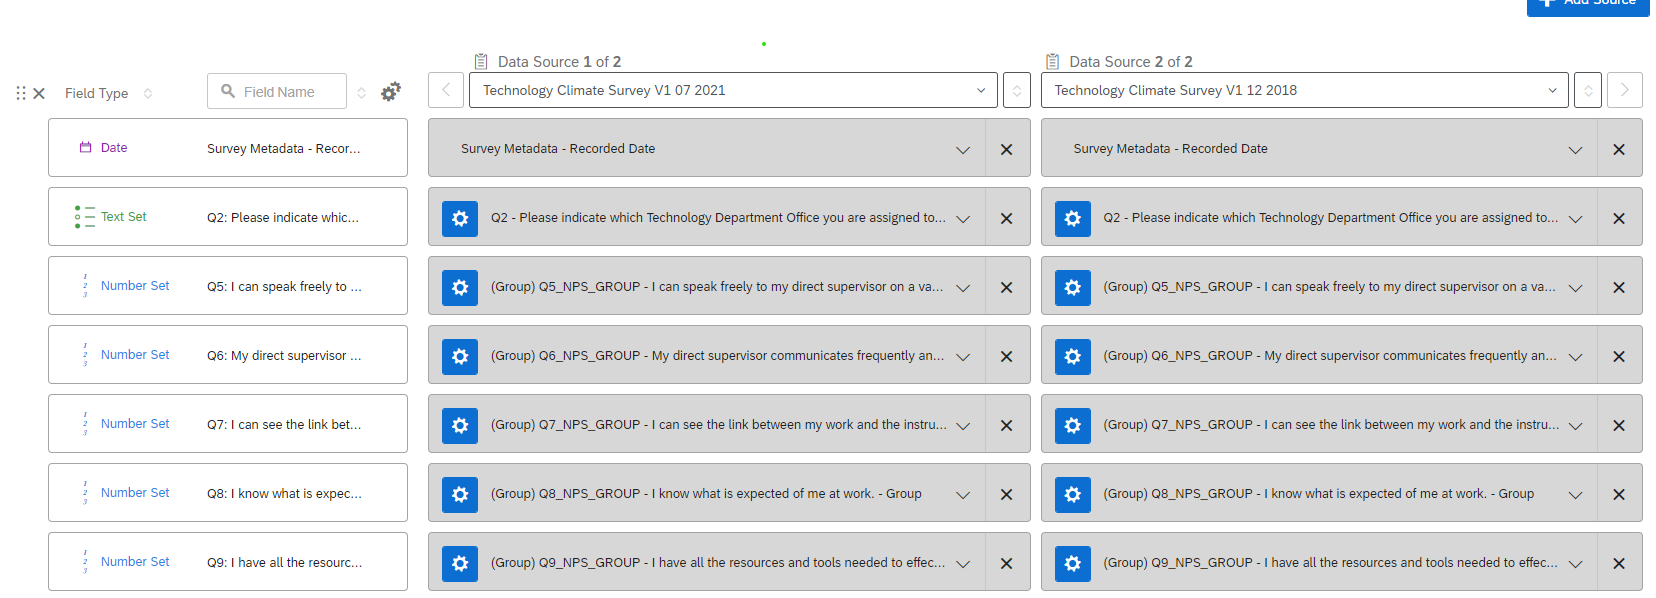 If I go create a chart and set the Data Set Source field as the data series (or create a table and set the Data Set Source as the columns), I only get the data from the 2018 survey.
 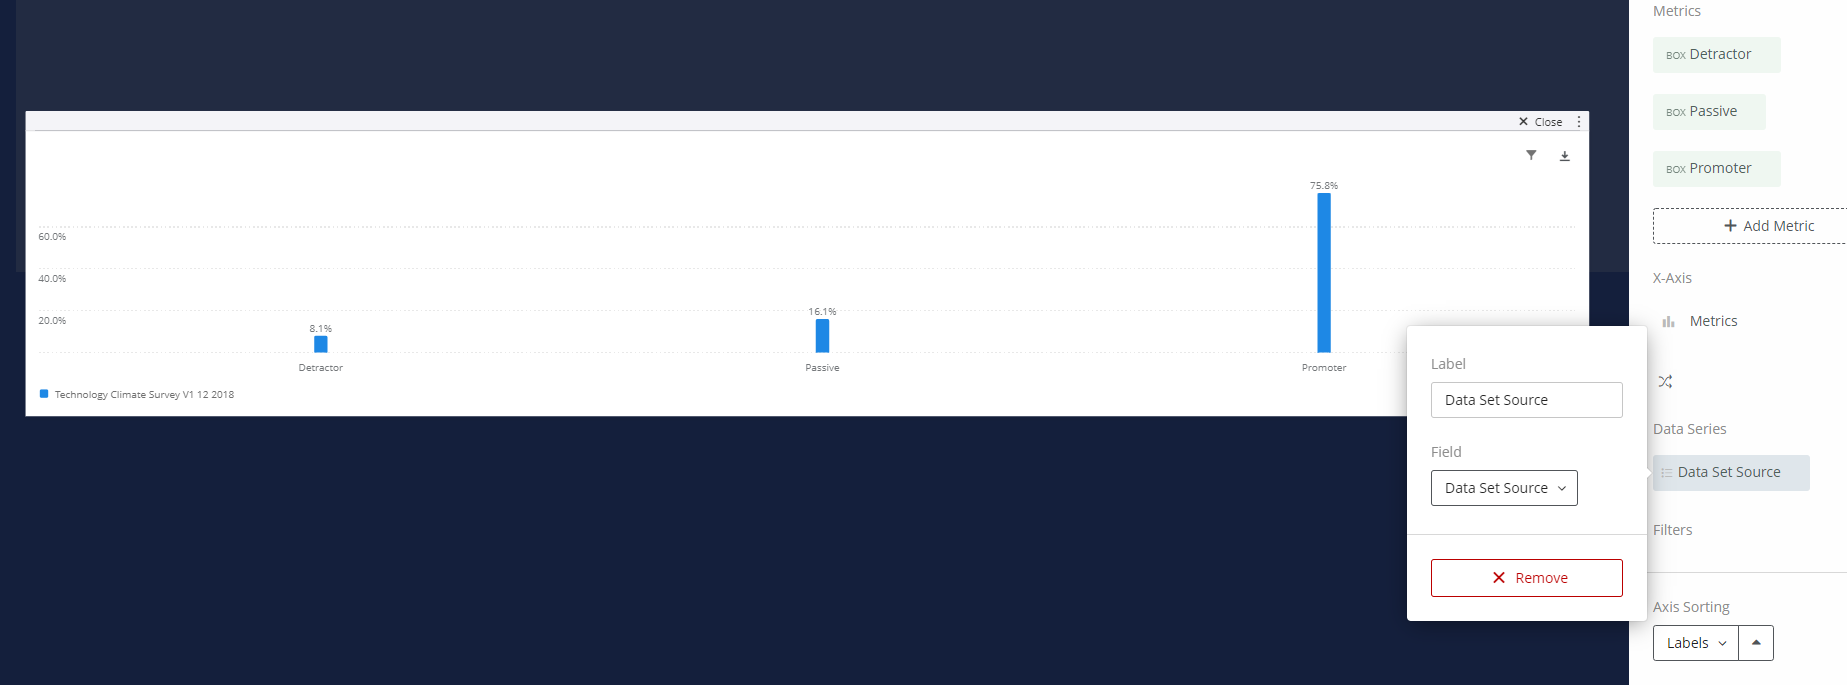 Could anyone help me figure out what I'm doing wrong?
Best answer by grahulp5
View original


