Tracking Data Month Over Month | XM Community
Question

Tracking Data Month Over Month

  • 31 December 2019
  • 2 replies
  • 34 views

Userlevel 4
Badge +20
I recently moved our tracking of vendor outages from an excel spreadsheet into Qualtrics. So far it's great and the business is loving the ease of reporting/documenting the outage as well as the dashboards I created. However, I have two sections in the spreadsheet that I am unsure how to fit into Qualtrics, _if at all_. Below is a short explanation of these two tabs as well as screen shot, I tried to include the formulas for those that speak excel. Until I am able to account for these two tabs in the survey the business is still using the excel spreadsheet. 😕 I feel like there is a way to accomplish this but I haven't learned enough about Qualtrics to say for sure. Thoughts?

#1 - BUSINESS DAYS & TOTAL MINUTES
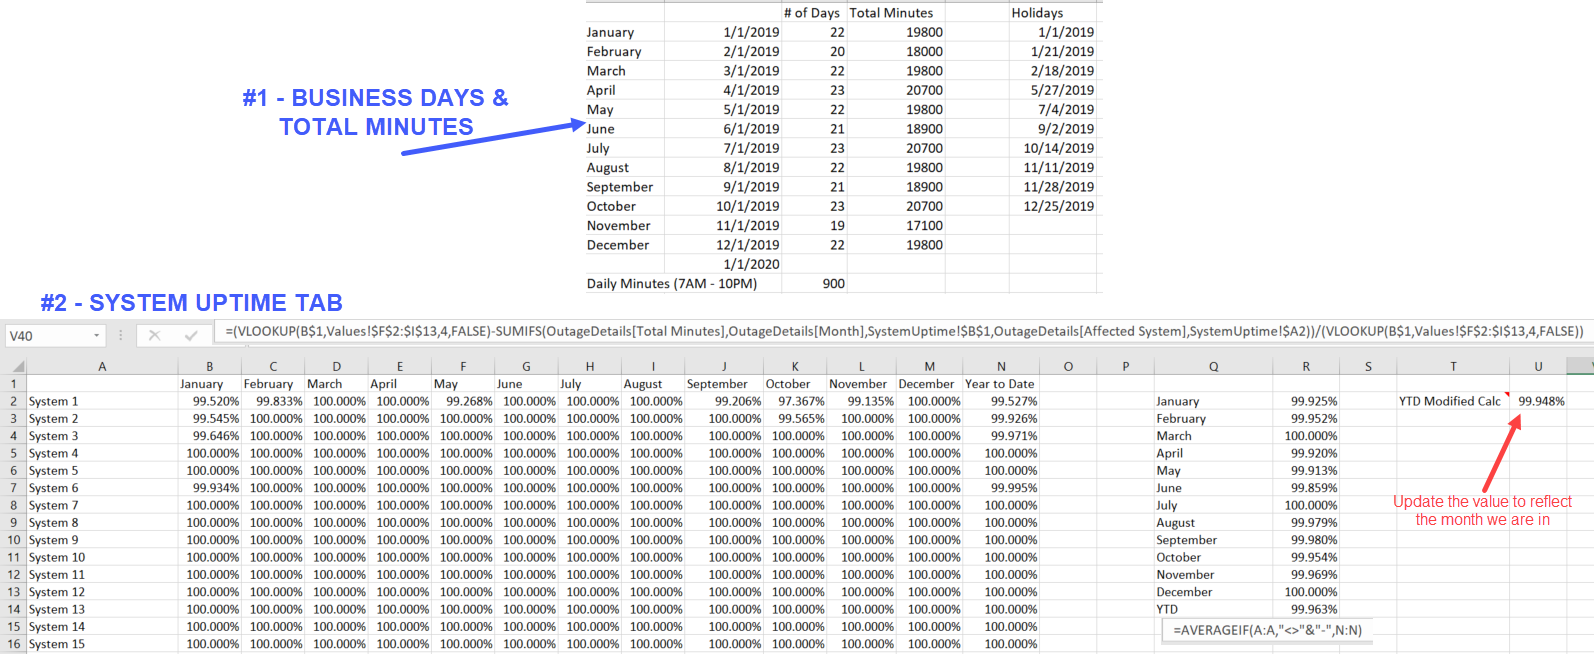
There is a tab that shows when the month begins (always on the 1st), the number of business days, the total minutes (daily minutes x # of business days) and the holidays for the month (although these are more informational than necessary).

#2 - SYSTEM UP-TIME
This tab contains a list of all of the systems in column A then column B - M represents up-time per month with column N showing the YTD. There is also a total system up-time to the far right.

!

Thank you in advance for any help or direction provided, it is greatly appreciated!

2 replies

Userlevel 3
Badge +6
Have you tried making a Measure Group out of these Fields in the Dashboard Data?
Userlevel 4
Badge +20
@Heith, I have not tried making a Measure Group as suggested. Honestly I have not heard of that! I will see what I can find in KB's and the community but if you have any suggestions on how to begin I'm all ears! Thanks for the suggestion 🙂

Leave a Reply