Embedded Data as time Frame for Comparisons | XM Community
Question

Embedded Data as time Frame for Comparisons

  • 26 February 2020
  • 3 replies
  • 40 views

Userlevel 1
Badge +7
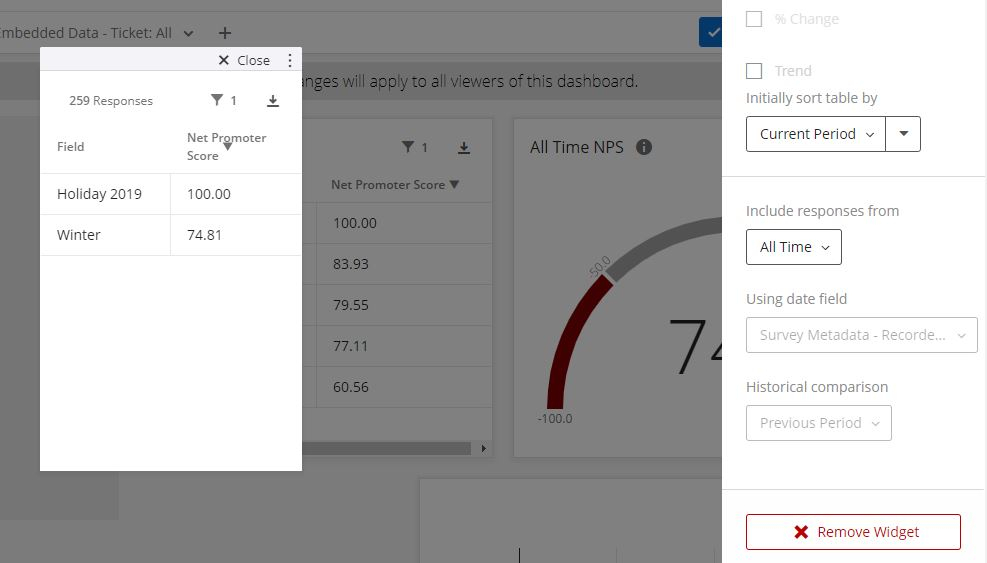
For our guest surveys, I use embedded data to record the season they visit. This is because they might receive and take the survey a month after their visit when we've entered into a new Season. I would like to be able to use the Breakdown Table in Dashboard to show the change in score from Winter 2019 to Winter 2020. In the picture below I'd like Historical comparison to be the season from the year prior.


!

3 replies

Userlevel 4
Badge +4
It looks like the issue is (maybe) that the season name isn't consistent from year to year. I see "Holiday 2019" and "Winter". Are those the same season but one is 2019 and one is 2020?

If they are using the same embedded data value then you can do a comparison of this year to last year and they will show in the same row.

If you are worried that you will get Winter 2019 data in January 2020 (and would show in the 2020 report) I would pass the date of visit into a separate embedded field and use that as the date field.

So you'd end up with two fields:
Season: Winter
Visit Year (or day or month): 2019-12-01 (I'd pass in the value as a YYYY-MM-DD even if it's month, so that you can use for trending in dashboards.

If you are using different values then you may want to consider mapping the values to a consistent value in your dashboard configuration so you can compare them in this widget. You could probably even map to a date based on the embedded data.

So you'd map from
Season: Holiday 2019
to:
New Season: Holiday
Year: 2019-01-01

I hope that helps and someone else may have an easier way to compare two different embedded data values in one row...but I can't think fo one.
Userlevel 1
Badge +7
Thanks, so Winter and Holiday are two separate seasons. We have Winter, Spring, Summer, Fall, and Holiday. I've also added Year after the fact since I'm using some historical data here.

Is there a way to show the change from Winter 2019 to Winter 2020 or just have the numbers side by side?
Userlevel 4
Badge +4
OK. Did you try:
Include Responses = This Year
Select "Previous Period" and "Percent Change"

This will show the current period (this year) and the Previous Period (last year) and show you the change.

If the issue is the last year versus this year using the survey date then that goes back to adding in the "Year" of the season as a date value YYYY-MM-DD so it can show as a date field.

!


!

Leave a Reply