


Hi,
I have a question regarding the set up of Gauge Charts. We are tracking employee mood over time and I want to show, how the mood improved or decreased from the previous week to the current week. I have seen in several presentations that there should? be a way to indicate this in Gauge Charts, for example like this: 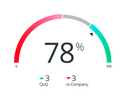 I have not found any documentation as to how to set this up? Maybe somebody could point me in the right direction?
Best regards,
Best answer by ChristianB
View original

