

Hi,
I have couple of multiple choice questions which measures confidence levels before and after training, this is split out by product category. I would like to add all seprate metrics together to show an overview of confidence levels before and after before breaking down by product. The issue I am having is adding all the metrics just shows many lines of data vs. a total for a line graph. Any help would be great.
Many thanks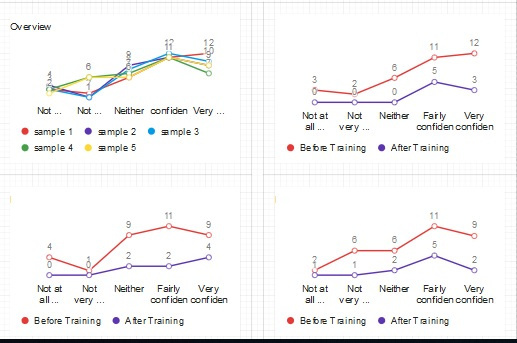
Best answer by LaurenK
View original
