I'm fumbling my way through adding a chart to my survey using chart.js. The chart will display an individual's scores over repeated survey attempts across 4 domains. The scores are saved as embedded data in a contact list and the idea is that the individual can access this graph (it's in a separate survey) after any attempt.
I'm having a problem with the graph showing data points for future attempts that haven't occurred. It's like the embedded data resolves to zero when it should just be blank. Eg. in the attached pic, Attempt 2 data points should not be showing.
Has anyone done anything similar with Qualtrics and have an idea on how to avoid these data points displaying? 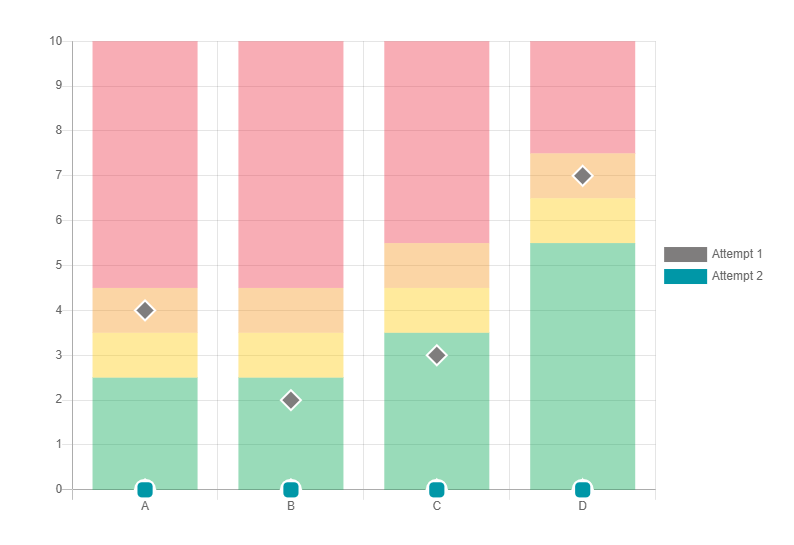

Chart.JS & embedded data
 +1
+1
Be the first to reply!
Leave a Reply
Enter your username or e-mail address. We'll send you an e-mail with instructions to reset your password.