Trying to produce a professional report that the user can consume easily.
My overall question is how to analyze survey data
- efficiently
- producing a professional report
Using a specific example here:
My goals for this 175 question survey, to produce
- descriptives for each of 175 questions
- crosstabs for the same survey (broken out by gender)
- a polished report that the from which the user can create their own Exec Summary and Key Findings
- and to do so efficiently
Previously, this was done in SPSS Statistics, but that's way overkill (and ugly), and there is no reason to use this powerhouse software - we're not doing any statistical analysis!
I have found Reporting / Stats iQ to be less than impressive for producing a polished report. For example, I could "press the button" and do a DESCRIBE on 175 questions, but it exports to Excel in 175 tabs, and UGLY. I wouldn't give that to a user. Then I need to do crosstabs (by gender), so this would be ANOTHER 175 tabs if exported to Excel, so again not acceptable imo.
My solution - import that data to Business Objects and build 175 charts (count,
") , then duplicate that and build the crosstab (by gender). It's taking like 5 days to do the whole thing. (Although next year, it will already be built, so it's a repeatable process).
, then duplicate that and build the crosstab (by gender). It's taking like 5 days to do the whole thing. (Although next year, it will already be built, so it's a repeatable process).Thoughts?
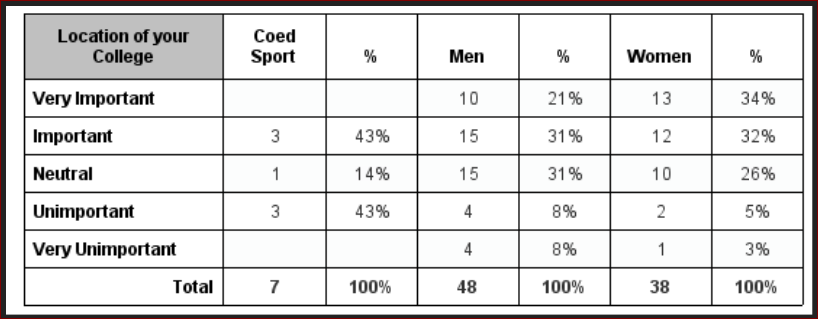
Here's a sample crosstab, but then x 175 and another 175 for the crosstabs