Join us for our quarterly Learn Qualtrics Live event series. During the event, attendees will have the opportunity to join breakout rooms where our experts will provide free training on Qualtrics features and products. Topics will rotate throughout the year. Space for this event is limited — please only register if you plan to attend live.
Please note: the list below automatically adjusts the event times to your browser’s time zone, and may appear differently on the registration page.
Our event hosts will actively answer questions on this post. If you have any questions about topics covered during the event, please comment below.
Comment telling us about your favorite part of the session!
Feedback
We value your insights and feedback. Please share your feedback on our Learn Qualtrics Live events here.
Page 1 / 1
Hi! Would this event be appropriate for any skill level? I’m interested in sharing with users at my organisation.
Hi! Would this event be appropriate for any skill level? I’m interested in sharing with users at my organisation.
Great question! This event is primarily catered towards beginner to intermediate Qualtrics users, but everyone is welcome
Hello,
I’ve seen you would say this is for beginner to intermediate I am not sure if I fall within the intermediate or more advanced than this. Are you able to share any examples of the level or topics covered?
Many thanks,
Nicole
Will this be recorded? Or is there another one of these events in the future? I have scheduling conflicts for the dates mentioned.
Thanks,
Cedrick
Hello,
I’ve seen you would say this is for beginner to intermediate I am not sure if I fall within the intermediate or more advanced than this. Are you able to share any examples of the level or topics covered?
Many thanks,
Nicole
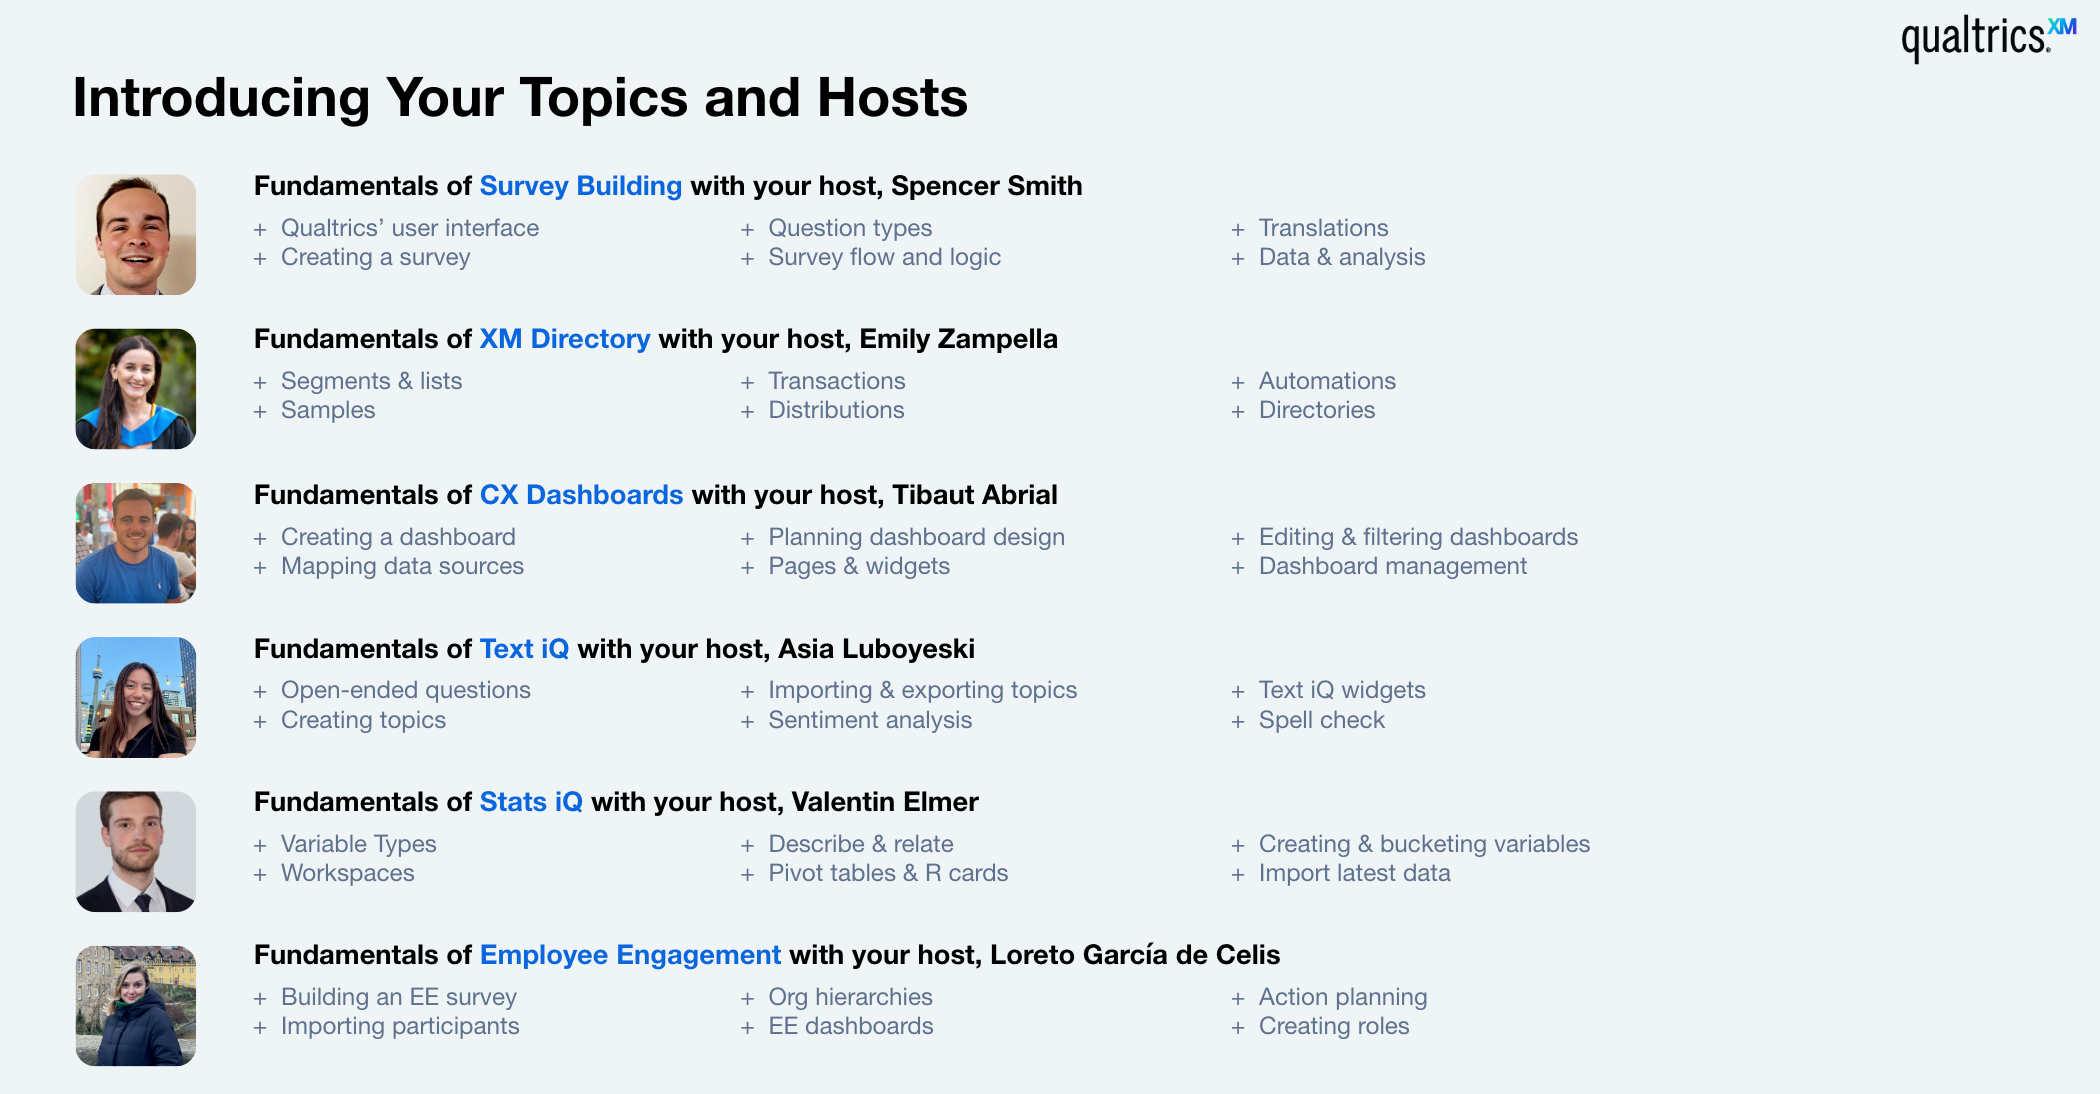
Hi @NicoleG! Here is a list of our speakers and the topics we’ll be covering at next week’s event!
Hi @Cedrick_Paschal!
These particular events will not be recorded; however, these sessions will run each quarter (about every three months). We actually just opened registration for our September events (see above)! We hope you can join us then!
Hi, I noticed as the event ended you could watch the other sessions. That page has now expired, is there a link somewhere to those sessions or will something be sent out.
I second @Amanda Shay , can you please provide a link to the other sessions?
Hi @Cedrick_Paschal!
These particular events will not be recorded; however, these sessions will run each quarter (about every three months). We actually just opened registration for our September events (see above)! We hope you can join us then!
So the only way to view content from the various breakouts that occur at the same time is to wait until the next quarter to view 1 at a time? These should be recorded so we can watch each session in a more timely manner.
I attended last night’s training on how to build a survey, however, the part for “Distribution” was briefly covered showing us the options available, but not how the process works.
I am looking to know how I can distribute a survey I have built using QR to big range of my audience while hosting a training session? (I do not have their phone numbers, only email addresses, I know I can distribute using their emails, but I want to get to know how the QR distribution process to wide range of audience not knowing their phone numbers would work), These audience are our organization external stakeholders.
Hi @Amanda Shay, @RMcB, and @twilhoit500!
We’re glad you enjoyed the sessions! You can watch the other sessions in the on-demand version of this event here on XM Basecamp!
You can also find training listed above as “XM Basecamp Courses” for each topic. These courses contain step-by-step how to videos that you can rewatch, pause, etc. The courses above are recommended to get you started, but we have many courses to choose from.
I hope this helps!
In the Dashboard session, I was hoping to see how to set up a Response Rate calculation. I’m told this has to be done before a survey is launched.
Also, when I add a filter to my dashboard so I can show only the Finished=TRUE responses, sometimes it shows “Survey Finished: All, 0, or 1” and sometimes it shows “Survey Finished: All, TRUE or FALSE”. Why do I get the TRUE option only sometimes? I have compared projects and they look the same…...
I attended last night’s training on how to build a survey, however, the part for “Distribution” was briefly covered showing us the options available, but not how the process works.
I am looking to know how I can distribute a survey I have built using QR to big range of my audience while hosting a training session? (I do not have their phone numbers, only email addresses, I know I can distribute using their emails, but I want to get to know how the QR distribution process to wide range of audience not knowing their phone numbers would work), These audience are our organization external stakeholders.
Hi @Mahnaz!
I’m excited for you to try out the QR code functionality. You won’t need respondents’ emails, phone numbers, or any other personal information as a QR code is tied to the survey’s anonymous link.
To distribute via QR code, follow these steps:
Click into the Distributions tab in the survey project
If your survey isn’t active yet, click the Get a single reusable link button to generate the anonymous link.
In the left-hand sidebar, click “QR code”.
The QR code will generate. Click Download.
After the QR code is downloaded, you can upload it into a presentation or print it off on a flier or poster.
Thanks Sean, but I want to distribute the survey via QR digitally not using any hard copies.
@SeanS
Thanks Sean, but I want to distribute the survey via QR digitally not using any hard copies.
Hi @Mahnaz! That isn’t a problem.
You would follow the same steps as above but instead of printing the QR code, you would just copy and paste the digital QR code into your slideshow or paste it into your email.
In the Dashboard session, I was hoping to see how to set up a Response Rate calculation. I’m told this has to be done before a survey is launched.
Also, when I add a filter to my dashboard so I can show only the Finished=TRUE responses, sometimes it shows “Survey Finished: All, 0, or 1” and sometimes it shows “Survey Finished: All, TRUE or FALSE”. Why do I get the TRUE option only sometimes? I have compared projects and they look the same…...
Hi @SlyNick. Sorry we didn’t have time to get to the response rate calculation.
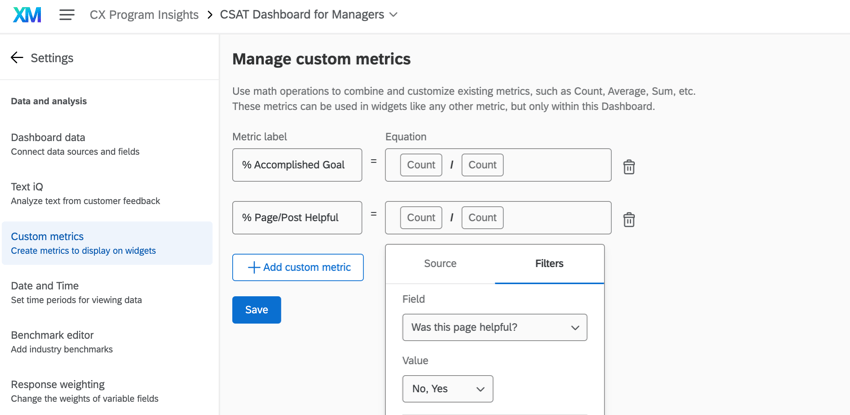
Yes, you're correct. The Response Rate calculation needs to be set up before launching the survey. Here's how you can do it:
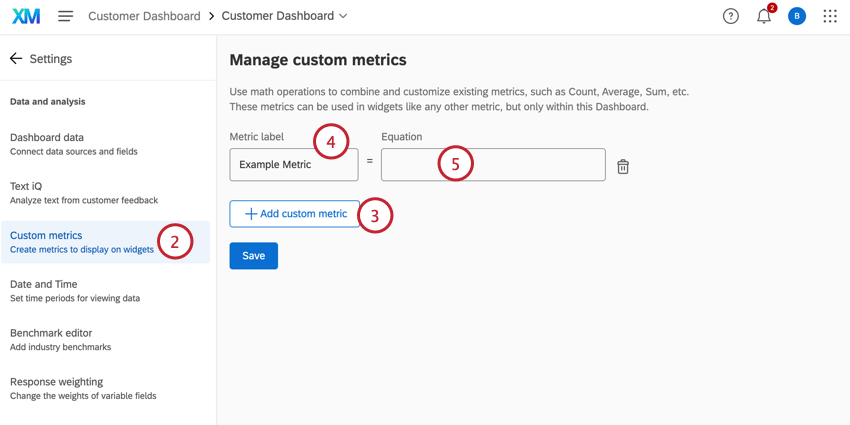
Navigate to the dashboard settings.
Click on the Custom Metrics page.
Click Add Custom Metric.
Name it “Response Rate.”
Add the following equation: (Count) / (Count).
Click the numerator.
Go to the Filters section.
Click Add Filter.
Select Survey Started.
Edit the filter to only include responses with a value of “Survey Started.”
Click Save.
This will create a custom metric for the Response Rate, which is calculated as the number of surveys responses that were started by clicking the survey link divided by the total number of recipients who received the survey. You can find these steps at this support page: XM Directory Respondent Funnel
On your other point, the difference in the filter options for "Survey Finished" (showing "0 or 1" versus "TRUE or FALSE") is likely due to how the data is mapped in your dashboard data.
In Qualtrics, "Survey Finished" is a field that indicates whether a respondent has completed a survey. This field can be mapped as a "Number Set" or a "Text Set".
If "Survey Finished" is mapped as a "Number Set", the filter options will be "0 or 1". Here, "0" represents "FALSE" (survey not finished) and "1" represents "TRUE" (survey finished).
If "Survey Finished" is mapped as a "Text Set", the filter options will be "TRUE or FALSE".
To check how the "Survey Finished" field is mapped in your dashboard, you can go to the Dashboard Data tab in your Dashboard Settings.
Please note that the data type for a field is set when the field is first mapped into the dashboard and cannot be changed once it's set. If you need to change the data type, you would need to map a new field with the correct type.
Hope this helps!
Thanks @SeanS. We calculate response rate as Survey Finished/Invited so I will try that. As for the TRUE vs 0/, both my dashboard funnels are set as Text Set: one shows TRUE and the other shows 0,1. I’ll submit a help ticket.
Hi @Cedrick_Paschal!
These particular events will not be recorded; however, these sessions will run each quarter (about every three months). We actually just opened registration for our September events (see above)! We hope you can join us then!
So the only way to view content from the various breakouts that occur at the same time is to wait until the next quarter to view 1 at a time? These should be recorded so we can watch each session in a more timely manner.
Thank you @SeanS
Hi @Cedrick_Paschal!
These particular events will not be recorded; however, these sessions will run each quarter (about every three months). We actually just opened registration for our September events (see above)! We hope you can join us then!
So the only way to view content from the various breakouts that occur at the same time is to wait until the next quarter to view 1 at a time? These should be recorded so we can watch each session in a more timely manner.
The September 10th live training says the meeting is at 11:00 PM. I am assuming this is supposed to be 11:00 AM? Thanks!
The September 10th live training says the meeting is at 11:00 PM. I am assuming this is supposed to be 11:00 AM? Thanks!
Hi @Cmborders,
The events listed are held around the globe, so if you are in the Americas, you should see a session late in the evening to accommodate our APAC region.
The time zones listed are automatically calculated using your browser’s time zone, so please double check the session time on the registration page when registering for a session!
In the CX dashboard what are the applications of Custom Metrics?
In the CX dashboard what are the applications of Custom Metrics?
Hi @susmitalakra,
Custom metrics are as they sound, the ability to create unique formulas for metrics you care about that might not be available out of the box in Qualtrics. Here are some key applications of custom metrics!
Creating Specific Measures: Custom metrics allow you to create specific measures that are important to your company. For example, you can create a custom metric to report the percentage of visitors who accomplished their goal on your website. This can be added to widgets just like an average NPS or CSAT.
Building Equations: You can use custom metrics to build equations based on one or more data fields. This allows you to create a single custom metric that pulls in data from different fields in your dashboard.
Reporting on Complex Metrics: Custom metrics can be used to report on more complex metrics such as custom scoring calculations or composite metrics. For example, in a Digital CX program, you might want to report the percentage of visitors who accomplished their goal on your website.
Adding to Widgets: Once created, custom metrics can be added to various widgets in your dashboard, such as line charts, bar charts, tables, number charts, donut/pie charts, and gauge charts.
Filtering and Customization: Custom metrics can be filtered and customized to show specific data points, making them highly adaptable to different reporting needs.
For more detailed steps on creating and using custom metrics, you can refer to the Custom Metrics support page.