I'm new here and after searching through the webpage, in which I could not really find the answer, I thought it would be more handy to ask my own question.
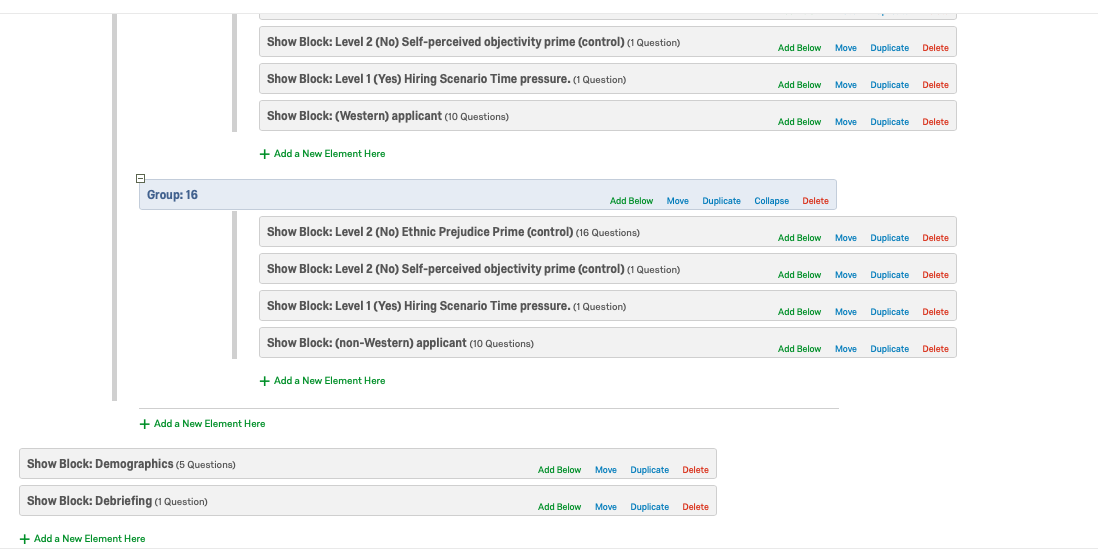
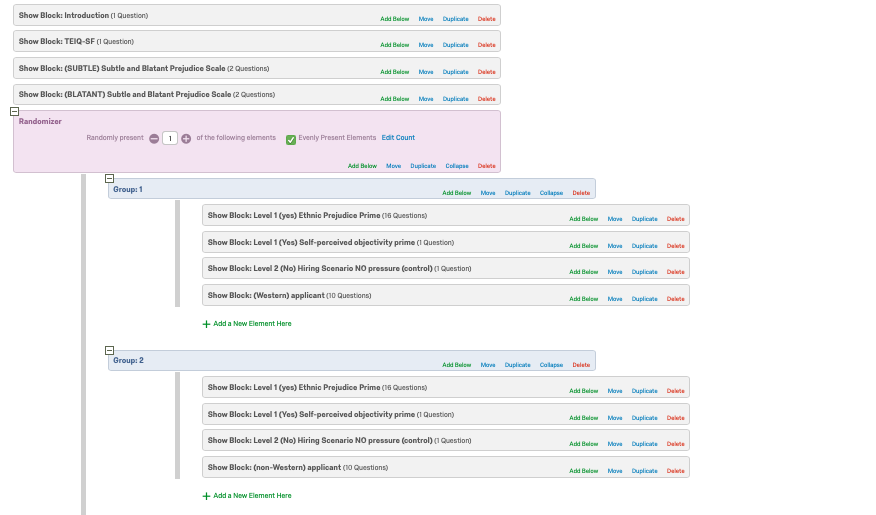
I'm doing a research for my Master thesis in Psychology. Now I've made a survey with different conditions (blocks in Qualtrics). The survey consists of 16 different groups (see screenshots of the beginning of the survey flow and the end).
I want to conduct a 2 (ethnic stereotypes scramble prime vs. control) x 2 (self-perceived objectivity vs. control) x 2 (time/social pressure in hiring scenario condition vs no time/ social pressure control condition) x 2 (Western vs. non-Western applicant) between-subjects design. Each of the factors will be run at two levels and all the 16 possible combinations.
I want to use ANOVA to measure the difference in cognitive dissonance in relation to organizational level, educational level and level of emotional intelligence. And a within-subjects t-tests to determine significant differences within each factor.
After collecting all the data I have to extract my results into SPSS, to do the analyses. So now I'm wondering three things.
1. How can I see in Qualtrics how many people are assigned to the groups (1 -16).
2. How do I extract the data into SPSS by keeping the responses separated per group, so I can easily compare the results with each other?
3. What do you guys think about my statical analysis plan?
I hope I made clear what I'm looking for, excuse me if my explanation is not very clear. English is not my first language.
Thanks in advance.
!
!