Hello!
I am working on a survey, within the survey I use HTML and Javascript code to generate a scatter plot where participants should input points (two points connected with a line), and a Reset Graph button.
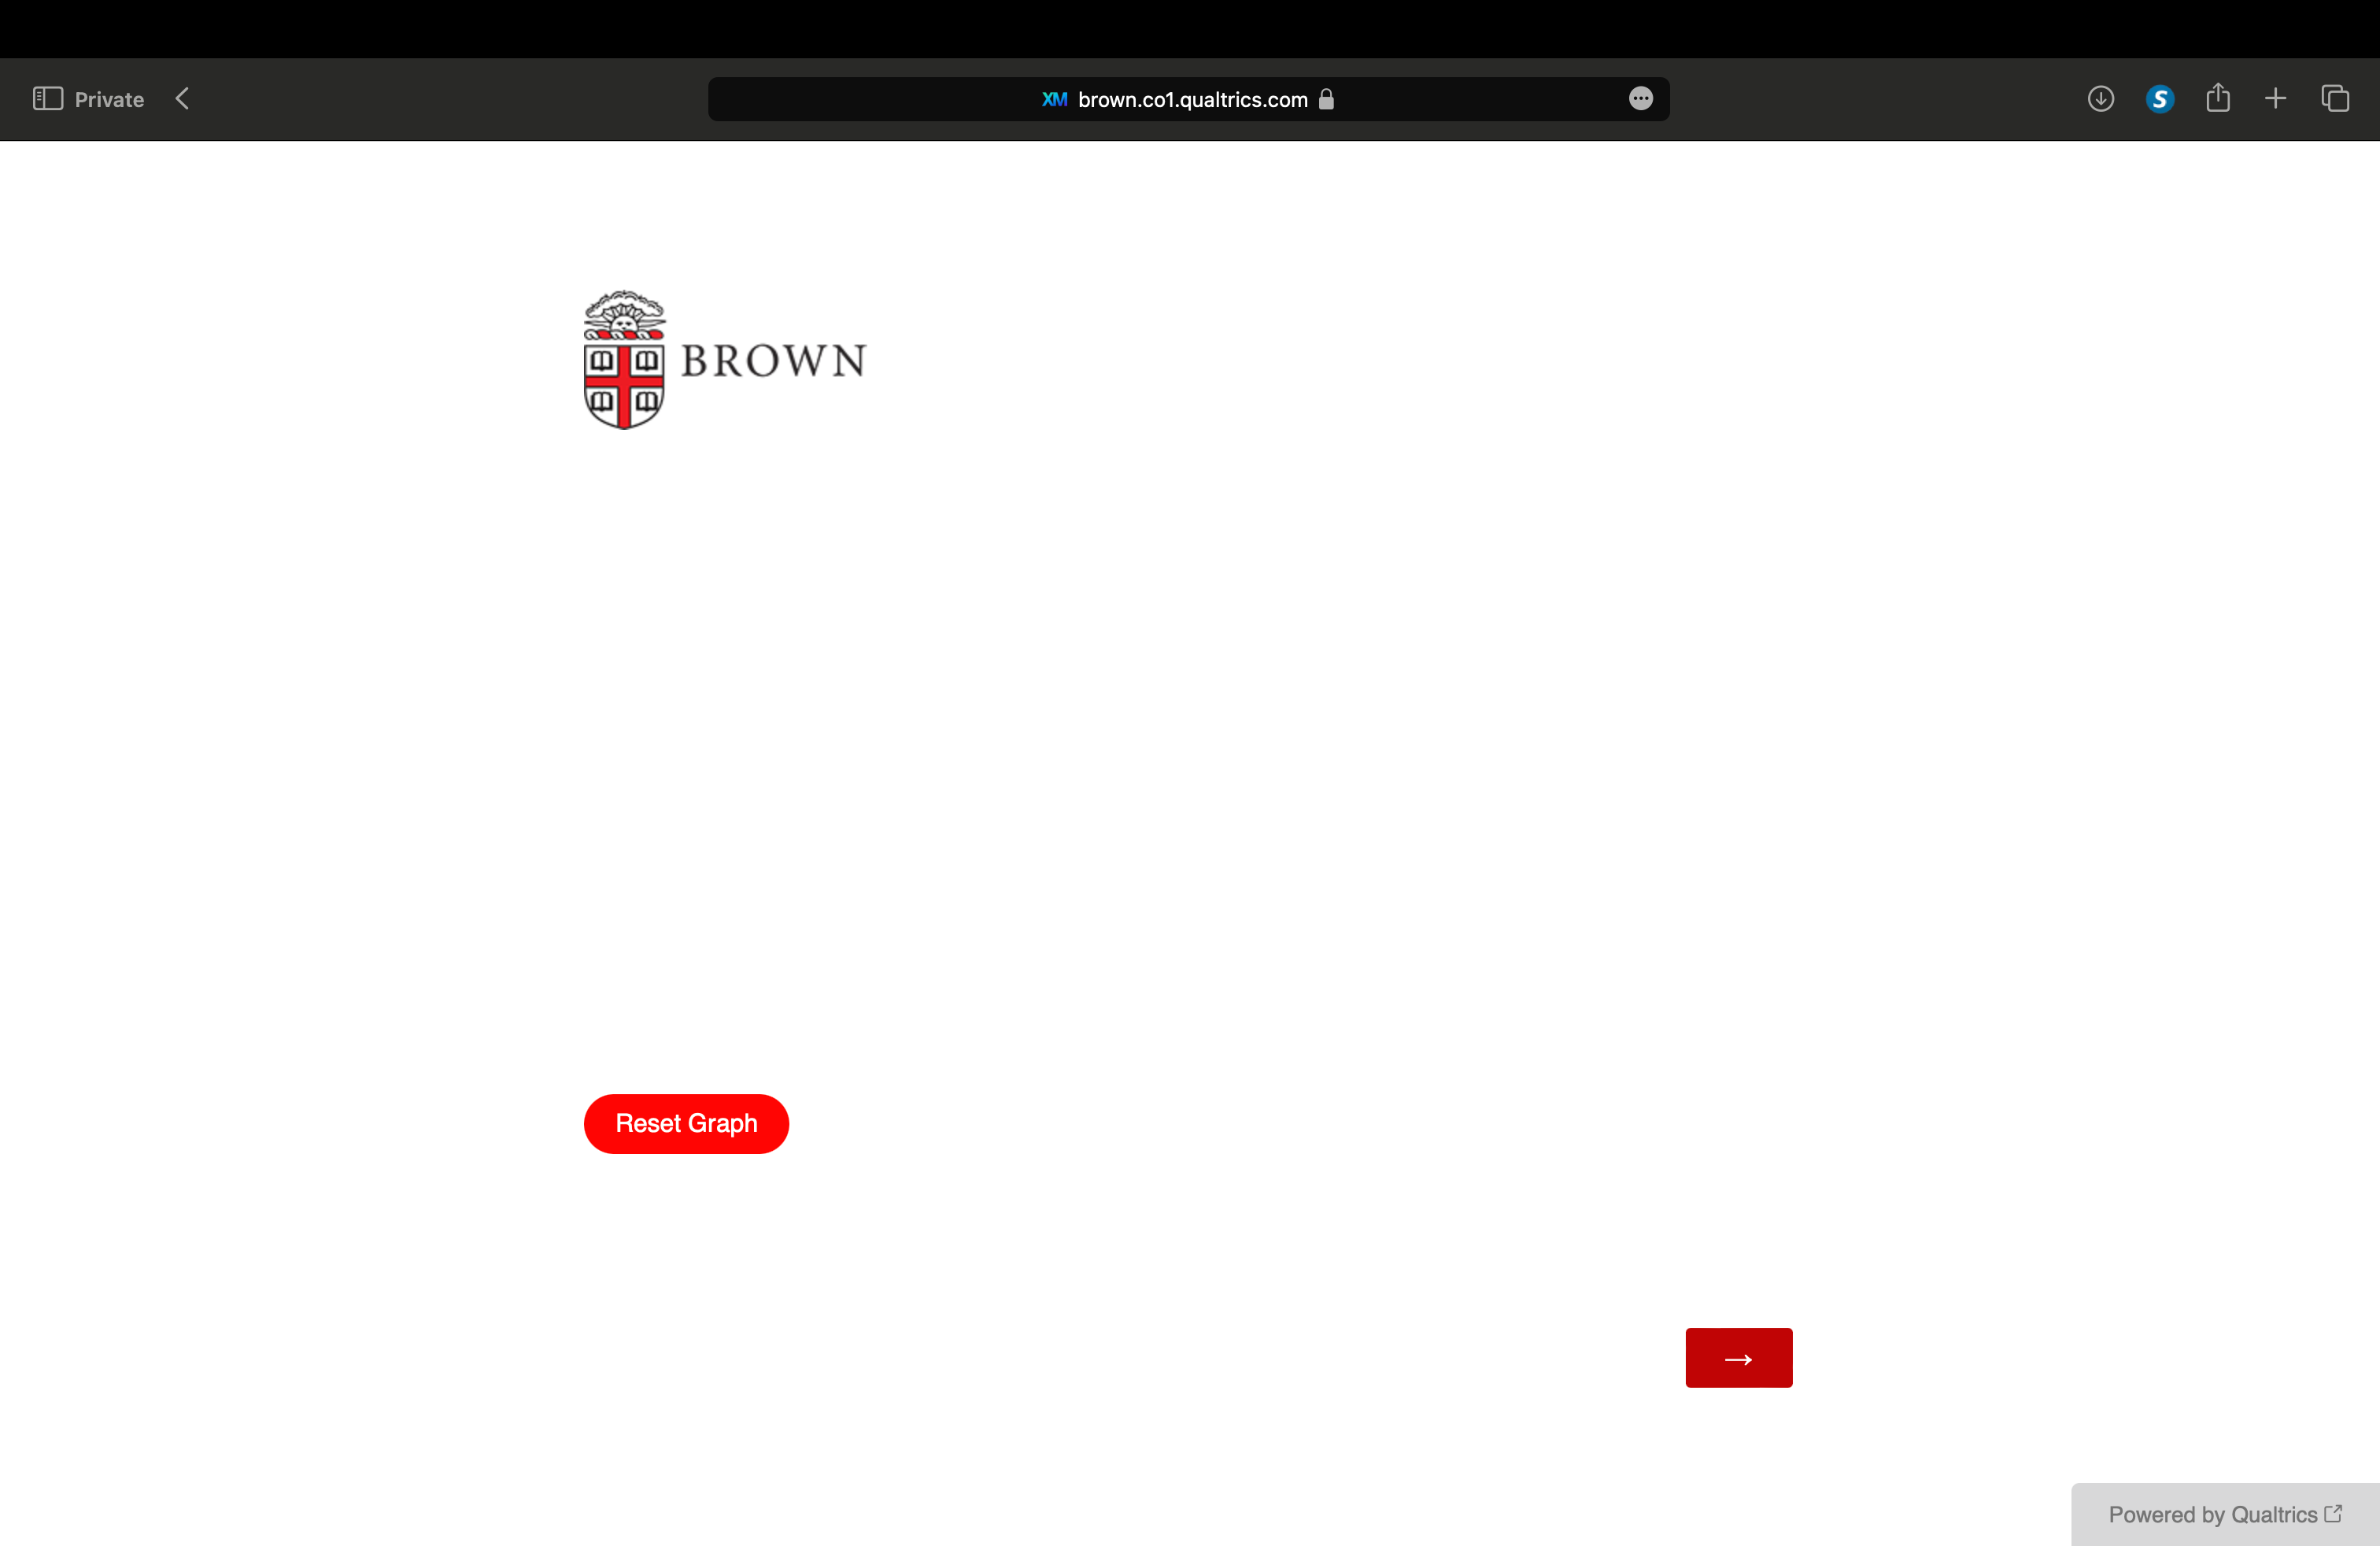
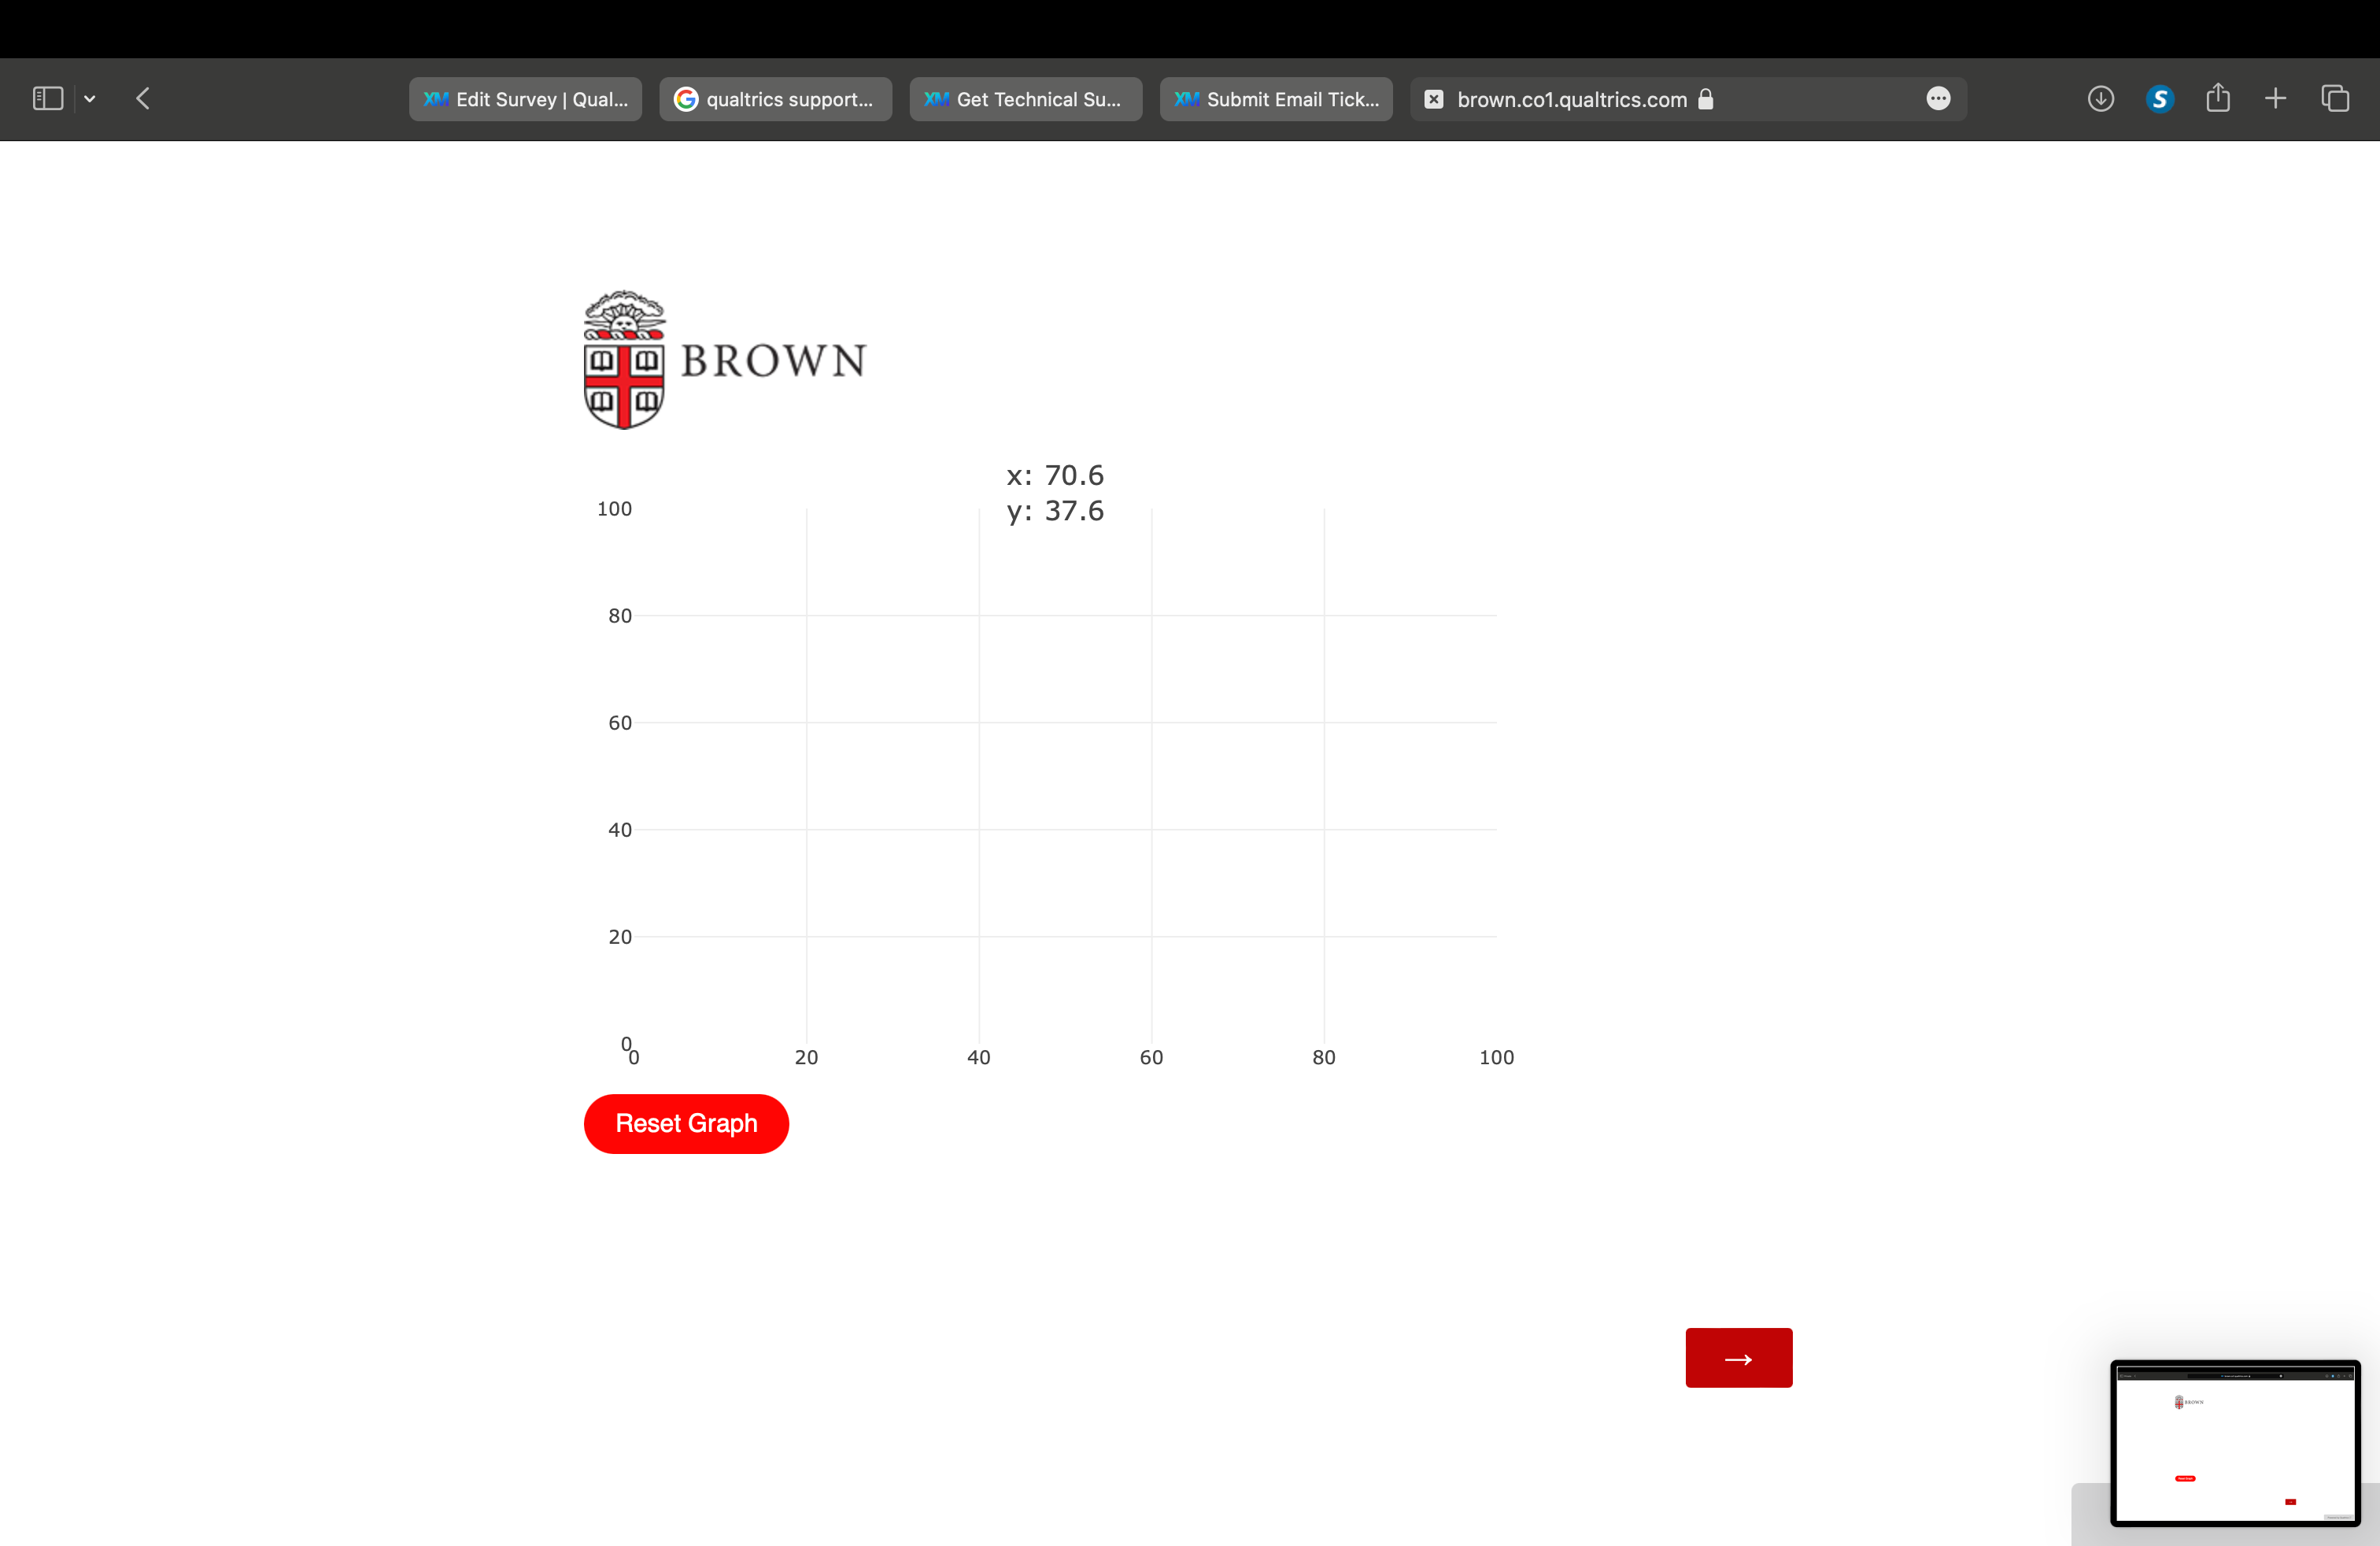
The published version of the survey works correctly ONLY in Safari when I’m logged into Qualtrics, it shows both the scatter plot and the Reset Graph button. If I open the survey literally anywhere else (chrome, Firefox, other computers), the published version only shows the Reset Graph button, NOT the scatter plot.
I tried to recreate a new project using the final Javascript / HTML code version, and looked into the settings of the survey, however, I could not resolve the issue. Can somebody please help me figure out what’s going on?
Thank you!
I attach JS / HTML code, and two screenshots of published versions where the scatter plot shows and doesn’t show - below:
HTML:
<!DOCTYPE html>
<html lang="en">
<head>
    <meta charset="UTF-8">
    <meta name="viewport" content="width=device-width, initial-scale=1.0">
    <title>Scatter Plot with Plotly</title>
    <script src="https://cdn.plot.ly/plotly-2.11.0.min.js"></script>
    <script src="//d3js.org/d3.v5.min.js"></script>
    <style>
        #resetButton {
            background-color: red;
            color: white;
            border: none;
            border-radius: 20px;
            padding: 10px 20px;
            font-size: 16px;
            cursor: pointer;
        }

        #resetButton:hover {
            background-color: darkred;
        }
    </style>
</head>

<body>

 <div id="plotlyContainer" style="width: 600px; height: 400px;"></div>
 <button id="resetButton">Reset Graph</button>
</body>
</html>
JavaScript:
// Comment: this version works, but needs additional styling of the Reset Button

Qualtrics.SurveyEngine.addOnload(function()
{
	/*Place your JavaScript here to run when the page loads*/ // (start of the Onload code)
	var d3 = Plotly.d3;
	var imgWidth = 0;
	var imgHeight = 0;
	const imgs = new Image();
	let plotCon  = document.getElementById('plotlyContainer');
	let resetButton = document.getElementById('resetButton');

	imgs.onload = function() {
	  imgWidth = this.width;
	  imgHeight = this.height;
	  loadImgGraph(imgWidth, imgHeight);
	}
	imgs.src = 'https://i.sstatic.net/cRbua.png';

	function loadImgGraph(imgWidth, imgHeight) {
	  var data = v
		{
		  x: r],
		  y: r],
		  type: 'scatter'
		}
	  ];
	var layout = {
	  autoscale: false,
	  xaxis: {
	  				autorange: false,
		  			fixedrange: true,
                    range: 0, 100],
                    anchor: 'y',
                    side: 'bottom',
                    zeroline: false
	  },
	  yaxis: {
	  				autorange: false,
		  			fixedrange: true,
                    range: 0, 100],
                    anchor: 'x',
                    side: 'left',
                    zeroline: false
	  },
		margin: {
		  l: 32,
		  r: 20,
		  b: 30,
		  t: 30
		},
	  };

	  // Create the graph
	  Plotly.newPlot('plotlyContainer', data, layout, {displayModeBar: false}).then(clickEv);

	  function clickEv() {
		var xaxis = plotCon._fullLayout.xaxis;
		var yaxis = plotCon._fullLayout.yaxis;
		var l = plotCon._fullLayout.margin.l;
		var t = plotCon._fullLayout.margin.t;

		// Display point coordinates at the top of the screen
		plotCon.addEventListener('mousemove', function(evt) {
		  var rect = plotCon.getBoundingClientRect();
                    var xInDataCoord = xaxis.p2d(evt.clientX - rect.left - l).toFixed(1);
                    var yInDataCoord = yaxis.p2d(evt.clientY - rect.top - t).toFixed(1);
					Plotly.relayout(plotCon, 'title', ,'x: ' + xInDataCoord, 'y: ' + yInDataCoord].join('<br>'));
		});

		// Add 2 points
		plotCon.addEventListener('click', function(evt){
			if (data	0].x.length < 2) {
				var rect = plotCon.getBoundingClientRect();
				/*
				data 0].x.push(xaxis.p2c(evt.x - rect.left - l))
				data 0].y.push(yaxis.p2c(evt.y - rect.top - t))
				Plotly.update(plotCon, data, layout);
				*/
				Plotly.extendTraces(plotlyContainer, {
				  x: />xaxis.p2c(evt.x - rect.left - l)]],
				  y: />yaxis.p2c(evt.y - rect.top - t)]]
				}, r0]);
				Qualtrics.SurveyEngine.setJSEmbeddedData('field', JSON.stringify(plotlyContainer.datat0]));
				Plotly.update(plotCon, data, layout);
			}
		});

		plotCon.on('plotly_click', function(){
		  alert('You clicked this Plotly chart!');
		});

		// Reset points
		resetButton.addEventListener('click', function() {
                    data 0].x = a];
                    data 0].y = a];
                    Plotly.update(plotCon, data, layout);
        });

		// Recording collected points into the Embedded Data in Qualtrics
		//Qualtrics.SurveyEngine.setJSEmbeddedData('field', JSON.stringify(plotlyContainer.datat0]));

	  }
	}

	// end of the Onload code
});

Qualtrics.SurveyEngine.addOnReady(function()
{
	/*Place your JavaScript here to run when the page is fully displayed*/

});

Qualtrics.SurveyEngine.addOnUnload(function()
{
	/*Place your JavaScript here to run when the page is unloaded*/

});
Screenshots: