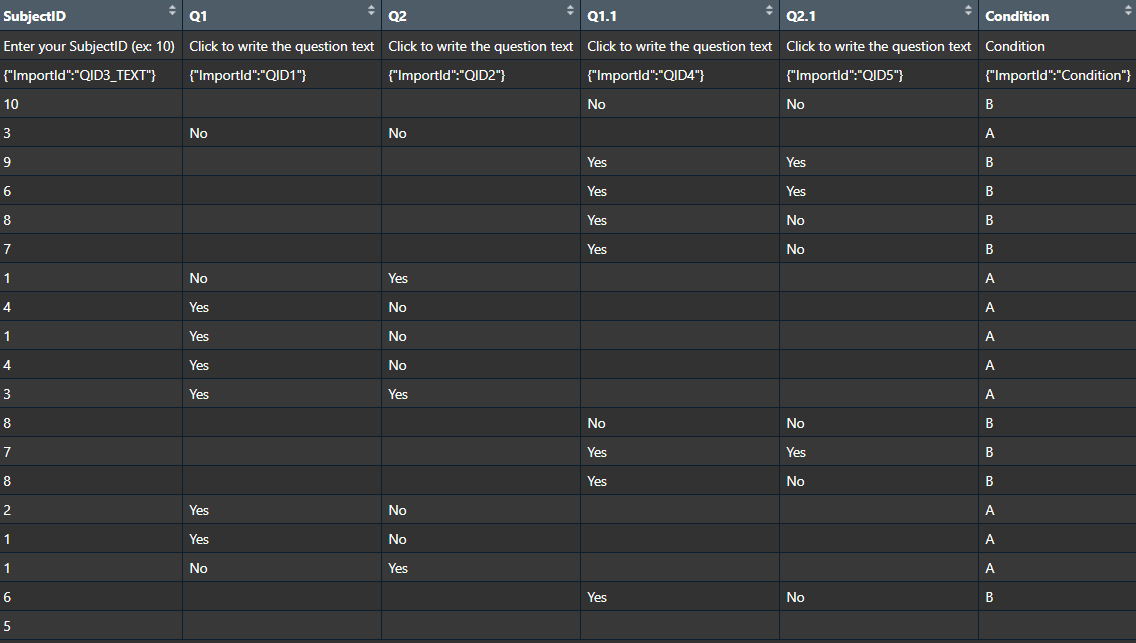
Currently, when I export the results of my Qualtrics survey, the output file contains one row per unique survey taken (which in this context corresponds to one row per person). Each question in the survey appears as a new column on that row.
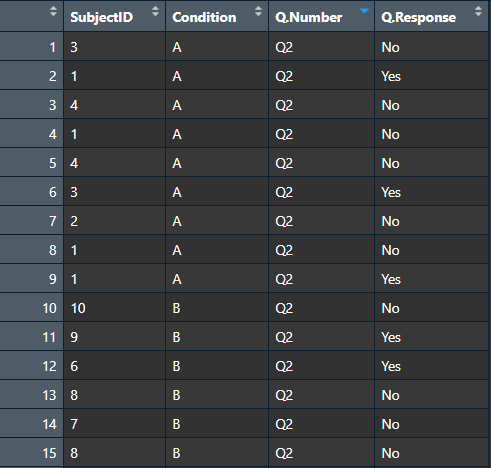
However, to do the statistical analysis I need in R or Pandas, I need a dataframe with one row per observation. In other words, a file where each response to each question is on a separate row, with the participant ID, question number, etc recorded in separate rows.
Visually:
Current Qualtrix export
SubjectID | Condition | Q1 | Q2 | ...
14 | A | Yes | No | ...
26 | B | No | No | ...
What I need:
SubjectID | Condition | Q.Number | Q.Response
14 | A | 1 | Yes
14 | A | 2 | No
26 | B | 1 | No
26 | B | 2 | No
Does anyone know how to export data in this format or any automated tools to assist that process?

Exporting Qualtrics data as a dataframe for R/Pandas
 +2
+2

 Hope this helps!
Sign up
Already have an account? Login

Welcome! To join the Qualtrics Experience Community, log in with your existing Qualtrics credentials below.
Confirm your username, share a bit about yourself, then you're ready to explore and connect .
Free trial account? No problem. Log in with your trial credentials to join.
No free trial account? No problem! Register here
Already a member? Hi and welcome back! We're glad you're here 🙂
You will see the Qualtrics login page briefly before being taken to the Experience Community.
Login with Qualtrics
Welcome! To join the Qualtrics Experience Community, log in with your existing Qualtrics credentials below.
Confirm your username, share a bit about yourself, then you're ready to explore and connect .
Free trial account? No problem. Log in with your trial credentials to join. No free trial account? No problem! Register here
Already a member? Hi and welcome back! We're glad you're here 🙂
You will see the Qualtrics login page briefly before being taken to the Experience Community.
Login to the Community
Welcome! To join the Qualtrics Experience Community, log in with your existing Qualtrics credentials below.
Confirm your username, share a bit about yourself, then you're ready to explore and connect .
Free trial account? No problem. Log in with your trial credentials to join.
No free trial account? No problem! Register here
Already a member? Hi and welcome back! We're glad you're here 🙂
You will see the Qualtrics login page briefly before being taken to the Experience Community.
Login with Qualtrics
Welcome! To join the Qualtrics Experience Community, log in with your existing Qualtrics credentials below.
Confirm your username, share a bit about yourself, then you're ready to explore and connect .
Free trial account? No problem. Log in with your trial credentials to join. No free trial account? No problem! Register here
Already a member? Hi and welcome back! We're glad you're here 🙂
You will see the Qualtrics login page briefly before being taken to the Experience Community.
Enter your E-mail address. We'll send you an e-mail with instructions to reset your password.