Integrating maps in Qualtrics with custom shapes | XM Community
Question

Integrating maps in Qualtrics with custom shapes

  • 17 July 2023
  • 2 replies
  • 117 views

Badge +1

Hi,


I wish to add maps in my survey where respondents can select one of many clusters/shapes of a map. Let’s say in map, I display the area of Milan with 4 clusters: East/West/North/South. What I need from respondents is to pick a cluster and record which cluster did they picked.

What I have done so far:

  1. I have added the map in my survey following https://github.com/pkmnct/qualtrics-google-map-lat-long
  2. I have explored that the hotspot/heatmap question can fit my issue but they only accept images as input - so not sure if it is a wise choice.

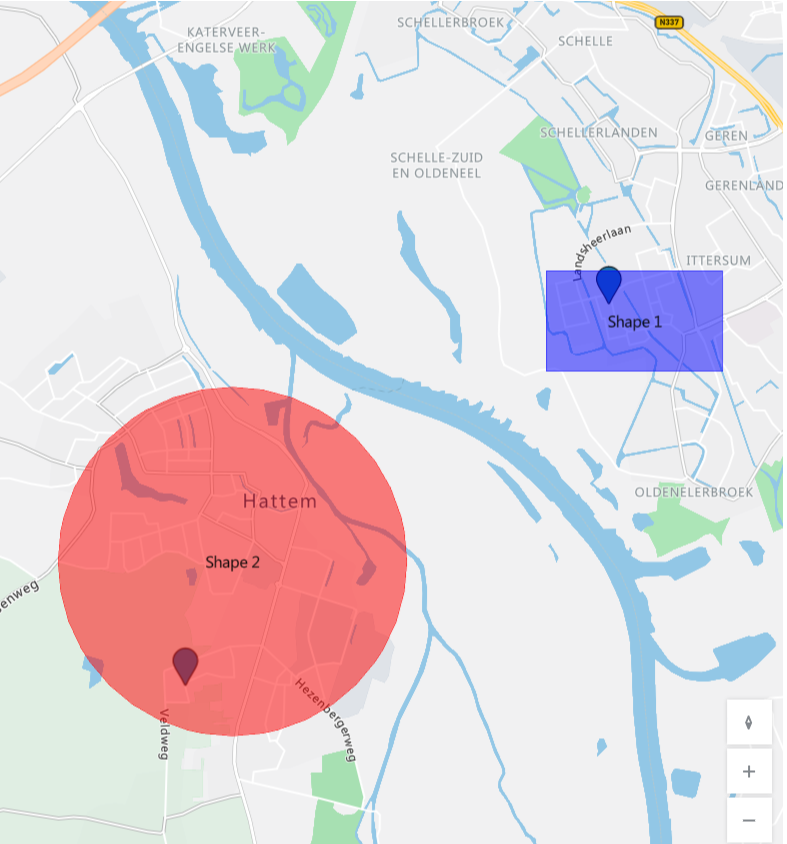
Below is the image that I want to show the participants: Here they need to pick one of the shapes to place a pin. (Ignore the two pins)

An interactive map where participants can place pins


Matt_Christie_Walker 

GradStudent 

ahmedA


2 replies

Userlevel 3
Badge +10

The way I would approach this is to have it be a multiple choice question, and use Javascript to hide the multiple choice options. Then use Javascript event handlers to set the answer of the (hidden) multiple choice depending on where on the map the participant clicks. So e.g. if they click East Milan, you would have Javascript select the “East” option beneath the hood. 

Userlevel 7
Badge +22

The below example is using a Map JS library integrated in Qualtrics.


Leave a Reply