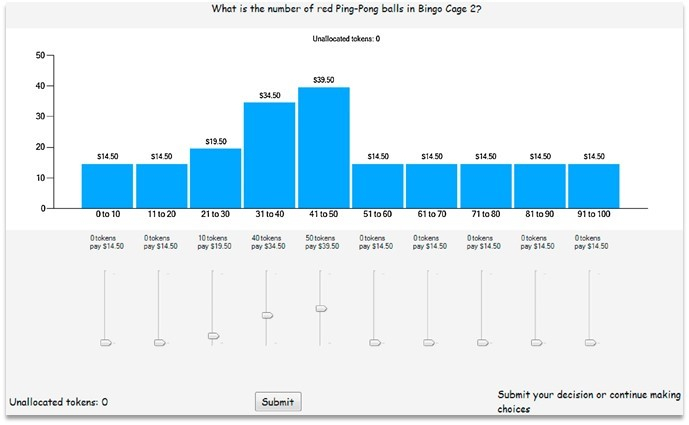
 The goal is to have a histogram in which the participant can adjust the sliders to represent preferences/beliefs in which one should also be able to adjust the number of visible sliders. The original histogram was programmed by another team of researchers in a different coding environment. And while I have a basic understanding of JS, I am nowhere near proficient to get to this point by myself.
I would greatly appreciate any pointers, code snippets or blue prints that I could use to obtain the needed result.
Thank you!
The goal is to have a histogram in which the participant can adjust the sliders to represent preferences/beliefs in which one should also be able to adjust the number of visible sliders. The original histogram was programmed by another team of researchers in a different coding environment. And while I have a basic understanding of JS, I am nowhere near proficient to get to this point by myself.
I would greatly appreciate any pointers, code snippets or blue prints that I could use to obtain the needed result.
Thank you!Producing a dynamic histogram
 The goal is to have a histogram in which the participant can adjust the sliders to represent preferences/beliefs in which one should also be able to adjust the number of visible sliders. The original histogram was programmed by another team of researchers in a different coding environment. And while I have a basic understanding of JS, I am nowhere near proficient to get to this point by myself.
I would greatly appreciate any pointers, code snippets or blue prints that I could use to obtain the needed result.
Thank you!
The goal is to have a histogram in which the participant can adjust the sliders to represent preferences/beliefs in which one should also be able to adjust the number of visible sliders. The original histogram was programmed by another team of researchers in a different coding environment. And while I have a basic understanding of JS, I am nowhere near proficient to get to this point by myself.
I would greatly appreciate any pointers, code snippets or blue prints that I could use to obtain the needed result.
Thank you!Sign up
Already have an account? Login

Welcome! To join the Qualtrics Experience Community, log in with your existing Qualtrics credentials below.
Confirm your username, share a bit about yourself, Once your account has been approved by our admins then you're ready to explore and connect .
Free trial account? No problem. Log in with your trial credentials to join.
No free trial account? No problem! Register here
Already a member? Hi and welcome back! We're glad you're here 🙂
You will see the Qualtrics login page briefly before being taken to the Experience Community
Login with Qualtrics

Welcome! To join the Qualtrics Experience Community, log in with your existing Qualtrics credentials below.
Confirm your username, share a bit about yourself, Once your account has been approved by our admins then you're ready to explore and connect .
Free trial account? No problem. Log in with your trial credentials to join. No free trial account? No problem! Register here
Already a member? Hi and welcome back! We're glad you're here 🙂
You will see the Qualtrics login page briefly before being taken to the Experience Community
Login to the Community

Welcome! To join the Qualtrics Experience Community, log in with your existing Qualtrics credentials below.
Confirm your username, share a bit about yourself, Once your account has been approved by our admins then you're ready to explore and connect .
Free trial account? No problem. Log in with your trial credentials to join.
No free trial account? No problem! Register here
Already a member? Hi and welcome back! We're glad you're here 🙂
You will see the Qualtrics login page briefly before being taken to the Experience Community
Login with Qualtrics

Welcome! To join the Qualtrics Experience Community, log in with your existing Qualtrics credentials below.
Confirm your username, share a bit about yourself, Once your account has been approved by our admins then you're ready to explore and connect .
Free trial account? No problem. Log in with your trial credentials to join. No free trial account? No problem! Register here
Already a member? Hi and welcome back! We're glad you're here 🙂
You will see the Qualtrics login page briefly before being taken to the Experience Community
Enter your E-mail address. We'll send you an e-mail with instructions to reset your password.

