
for a research project, I am looking to implement a dynamic histogram as attached in Qualtrics.
!
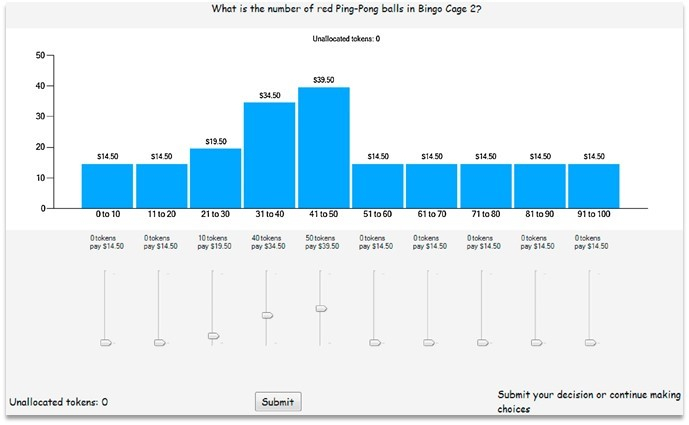
The goal is to have a histogram in which the participant can adjust the sliders to represent preferences/beliefs in which one should also be able to adjust the number of visible sliders. The original histogram was programmed by another team of researchers in a different coding environment. And while I have a basic understanding of JS, I am nowhere near proficient to get to this point by myself.
I would greatly appreciate any pointers, code snippets or blue prints that I could use to obtain the needed result.
Thank you!