I have collected different score via constant sum question in my survey. Now i want to create a table in dashboard from the results. The dashboard should look like this: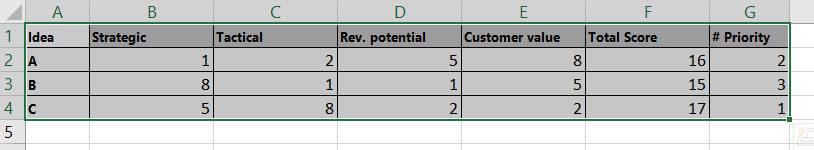 These numbers I will collect through surveys. The respondent will rate each idea based on criteria. Then i will need to collect the total score for each idea and then rank it based on the priority basis. I would like to reflect these results in a dashboard or reports. Can anyone give me few suggestions on how to approach this ?

Page 1 / 1
XormaP It sounds like you would be able to best display the average scores for the different ideas using either a Simple Table or a Simple Chart!
Either of these widgets will allow you to display the average score value or breakdown by criteria in the dashboard depending on how you would like to visualize the response data.
If you have any additional questions on troubleshooting the dashboard setup, please feel free to contact our Support Team as they will be best equipped to assist with this inquiry!
Leave a Reply
Enter your E-mail address. We'll send you an e-mail with instructions to reset your password.