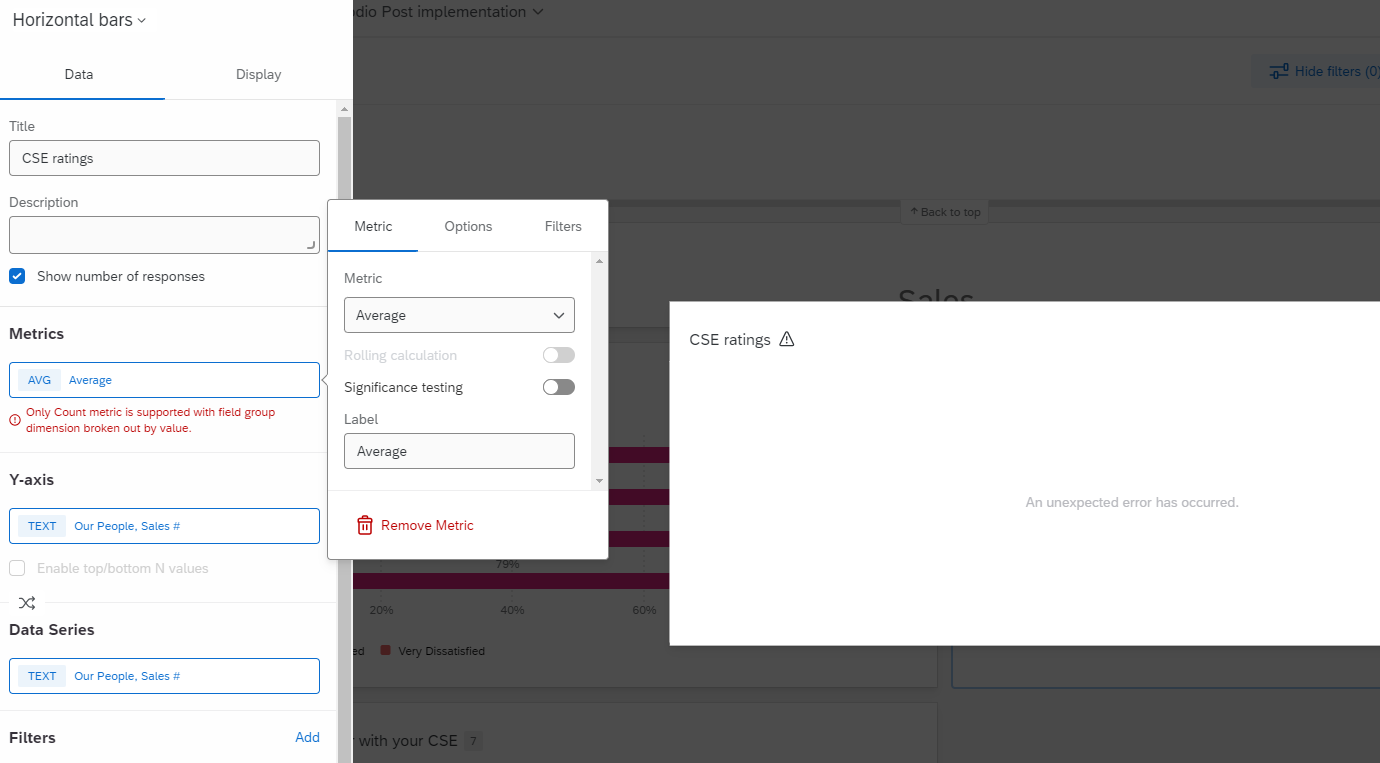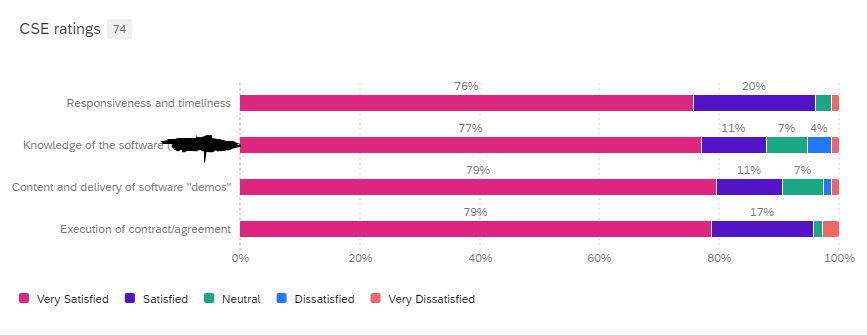
I have created a this CSAT measure group widget and want to keep it. I have been asked to give an “average” score for each of the shown categories. I know I can do recode values but am unsure of how to assign recode values to show an average score while also keeping the very satisfied-very dissatisfied widget.
Page 1 / 1
We can create new number set field in the dashboard data for the matrix question and use this for average widget.
I’m missing something here
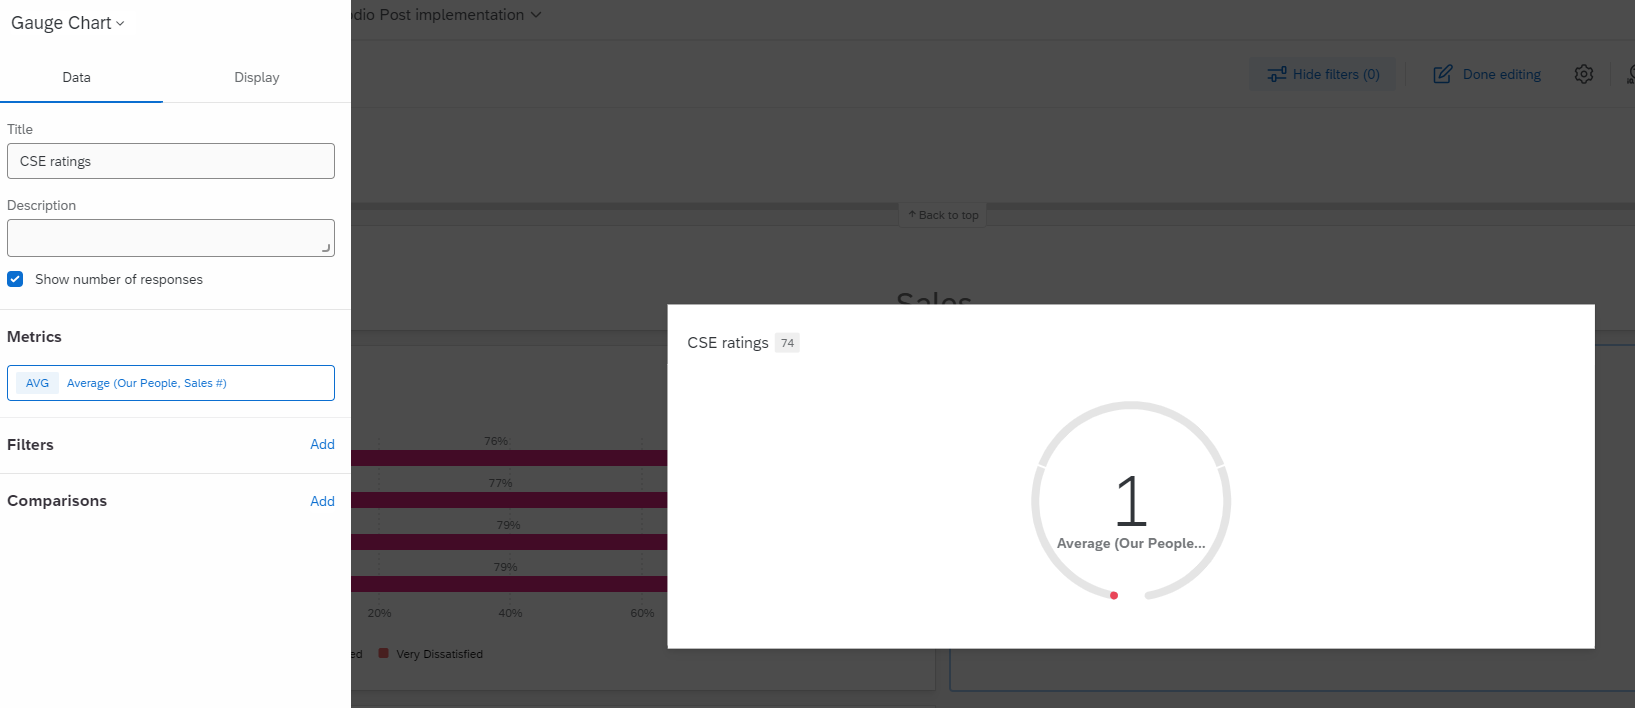
I also tried a gauge chart, which seemed “to work, but I’m confused at the average of “1” based off our high satisfaction scores it certainly shouldn’t be 1 (I triple checked my recode values on those survey questions).
Leave a Reply
Enter your E-mail address. We'll send you an e-mail with instructions to reset your password.