Unfortunately this is not possible, you have to create your own mapping list
The only good thing about finding this thread is to be able to confirm that I´m not the only person who would love to get that feature! 
Thanks, @kgillis !
you can create from support page, but if you want to create a document based on you dashboard, only way to do this, make a copy of the dashboard and give her access to copy version.
So that, even if there is a accidental changes, it wont affect your main dashboard.
@jbk , you mean: create a support page with a table. In that table, place every metadata, download it and start from there. Is that it?
If you want to create a generic document of mapping the fields, you can use this. But if you want to create from your dashboard, make a copy of your dashboard, create a user for your intern and share the copied version of the dashboard and ask your intern to create it.
@jbk , YOU ROCK!
For my need, which is different from @kgillis this will help a lot!
Thanks for the ideia1 ;)
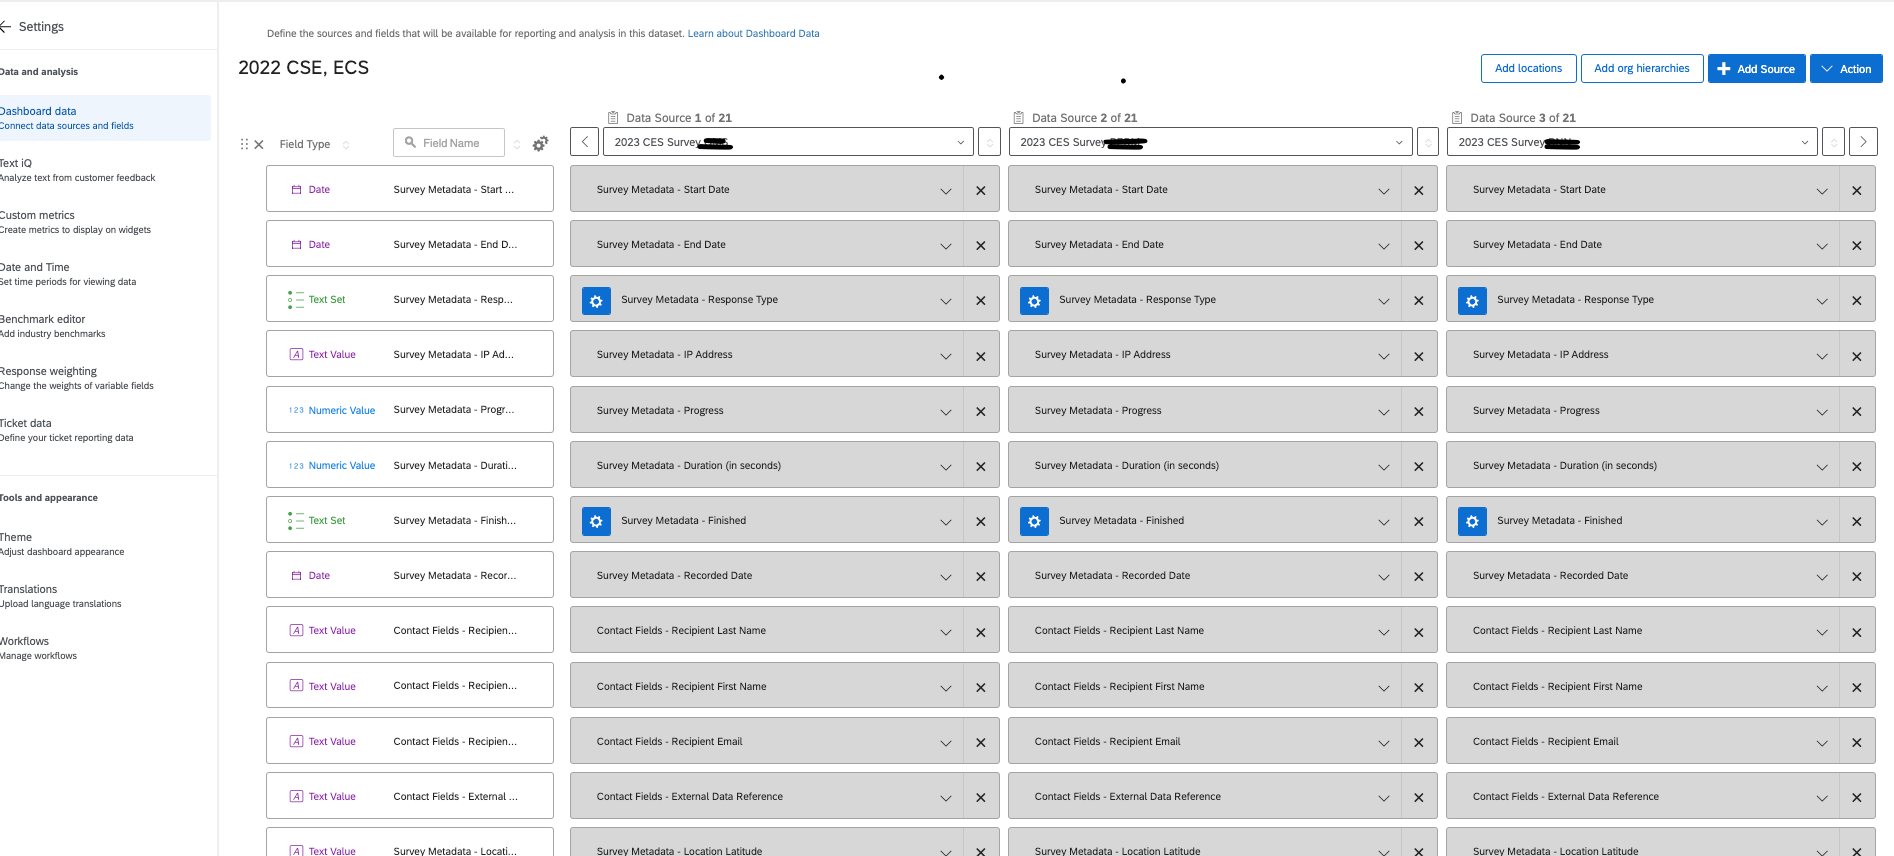
I was aiming to basically have like an excel/csv export of everything since I’ve got 21 different surveys mapped and 15 pages of fields, it’s a lot! A csv would be quicker to reference plus we could get it on one screen rather than having to move through separate pages.
I hear you.
However, unfortunately, that´s not possible yet.
The path @jbk suggeste will help you to get all the fields with field type mapped into the dashboard. An alternative I´ve used in the past was:
- Go to Data & Analysis;
- Export the file in .csv / .xlsx / .tsv ( normally I do it, by filtering the data in order to export just one row with data, so I can make sure I´m doing the data mapping with the right data type in the document).
- Open it in Excel, transpose the table and start from there.
It´s not an awsome way to do it but, it is an alternative.
I hope this helps in any way.