Hey colleagues,
Hope you are well.
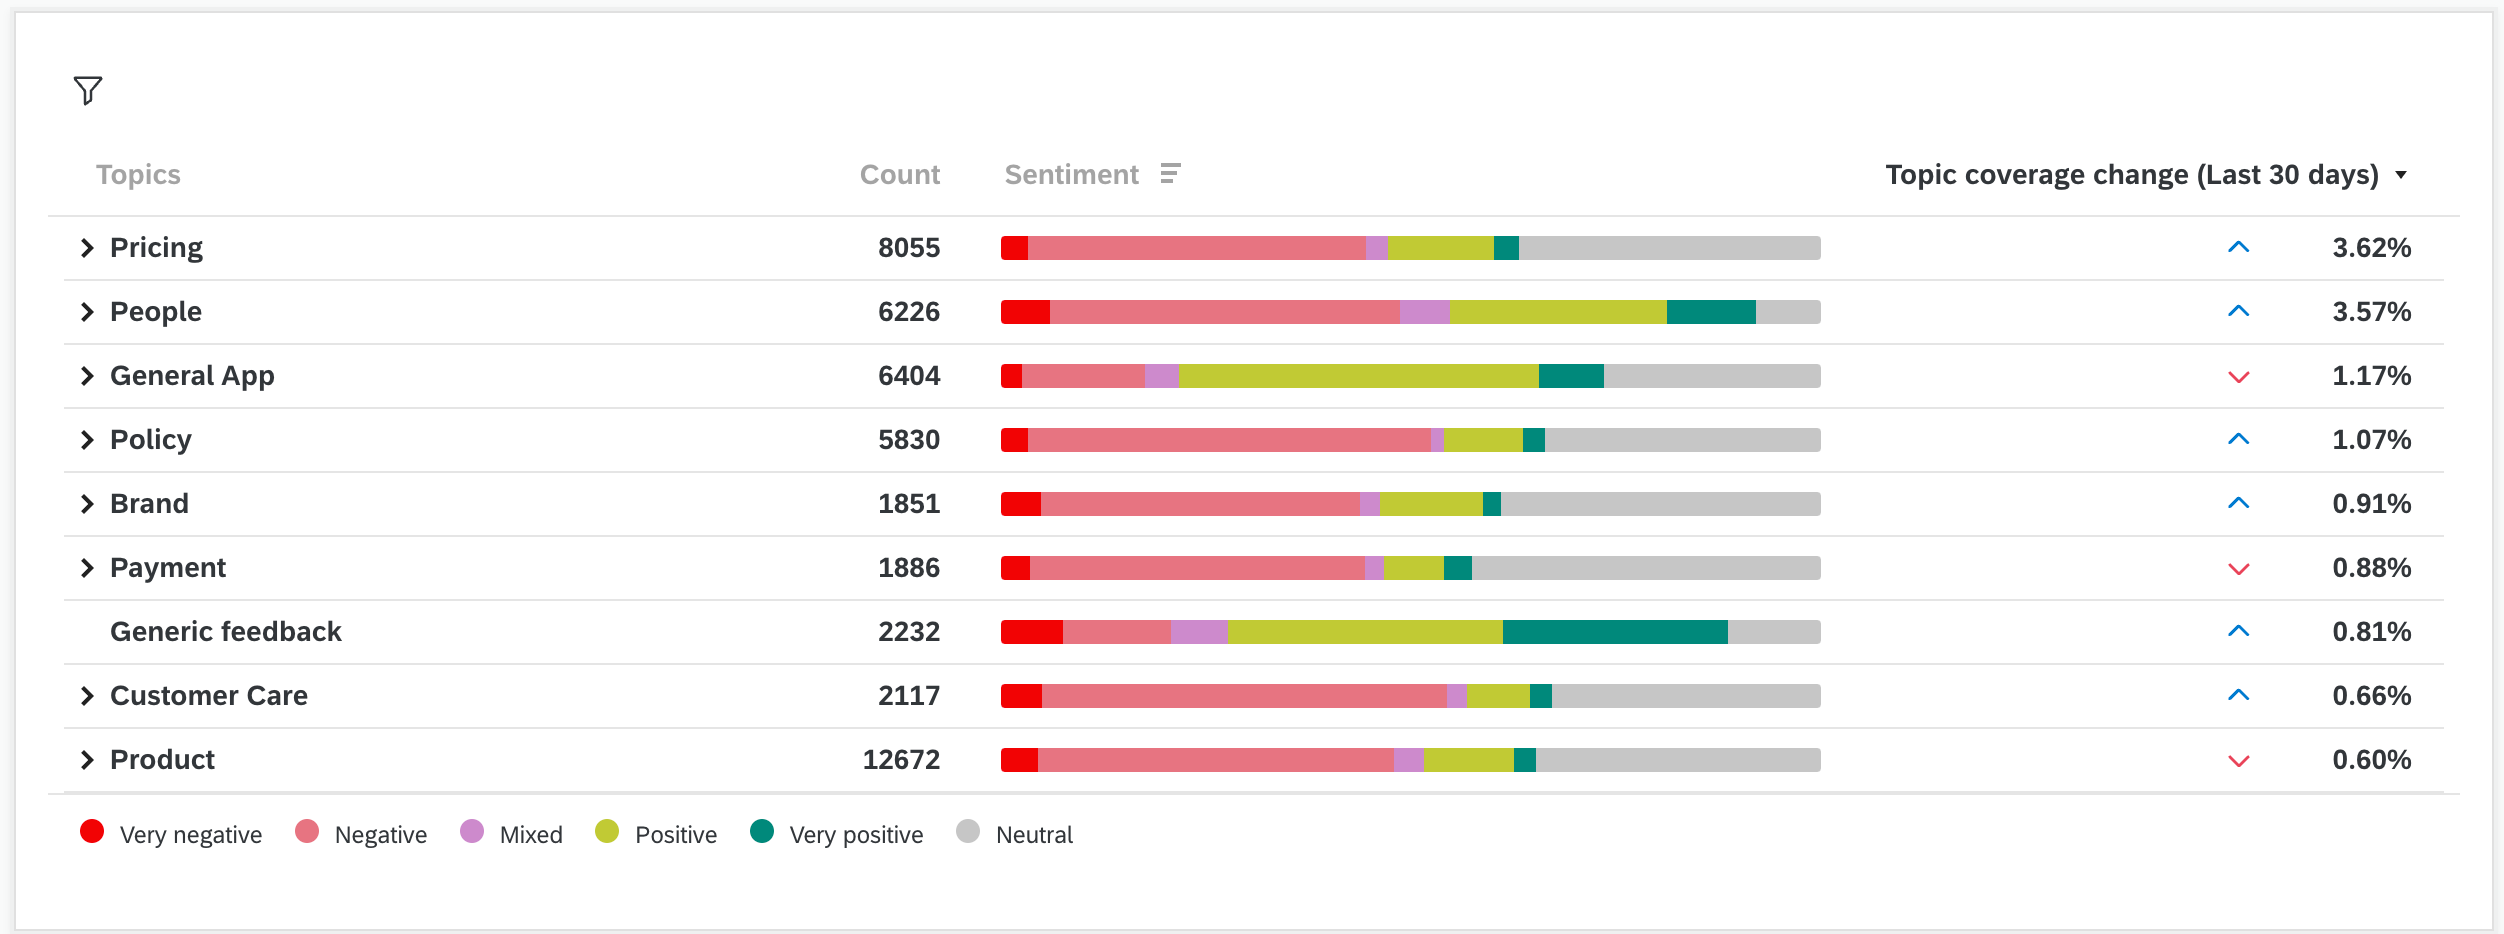
I wonder it it would be possible to adding columns in the Text IQ widget, in this below: I mean, in the survey we have an open ended question analysed with the Text IQ feature. We also have this question for different countries, as well as the rest of KPIs. We would like to compare "Text IQ" results among these countries in a more efficient way because actually the only way to do is getting the same widget filtered by country, but it means to have 10 different widgets.
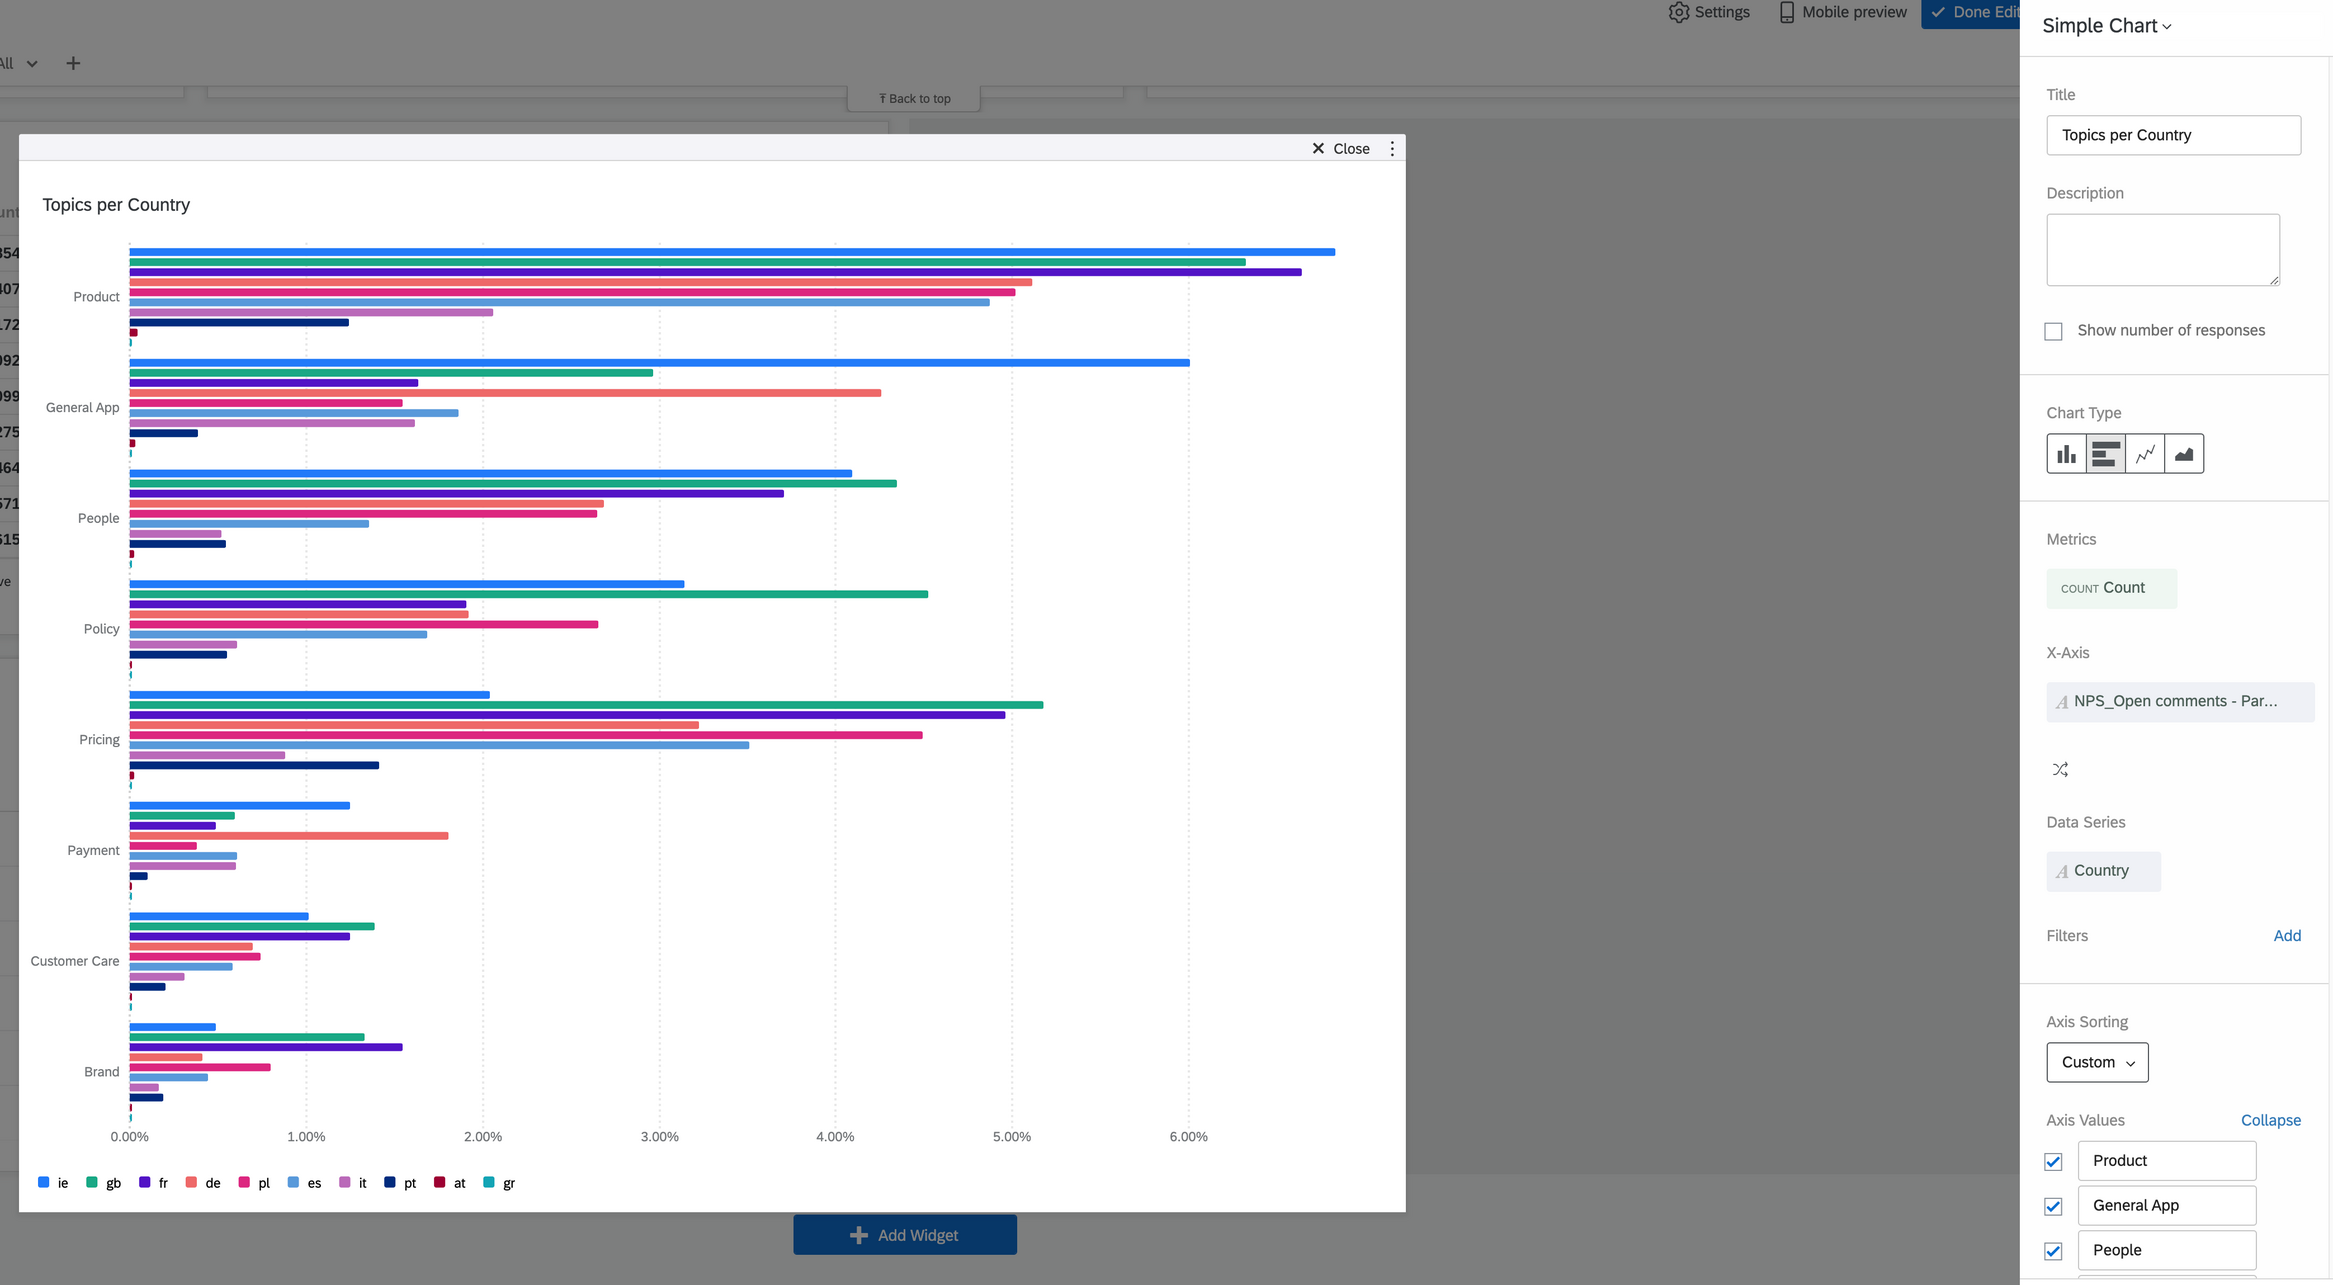
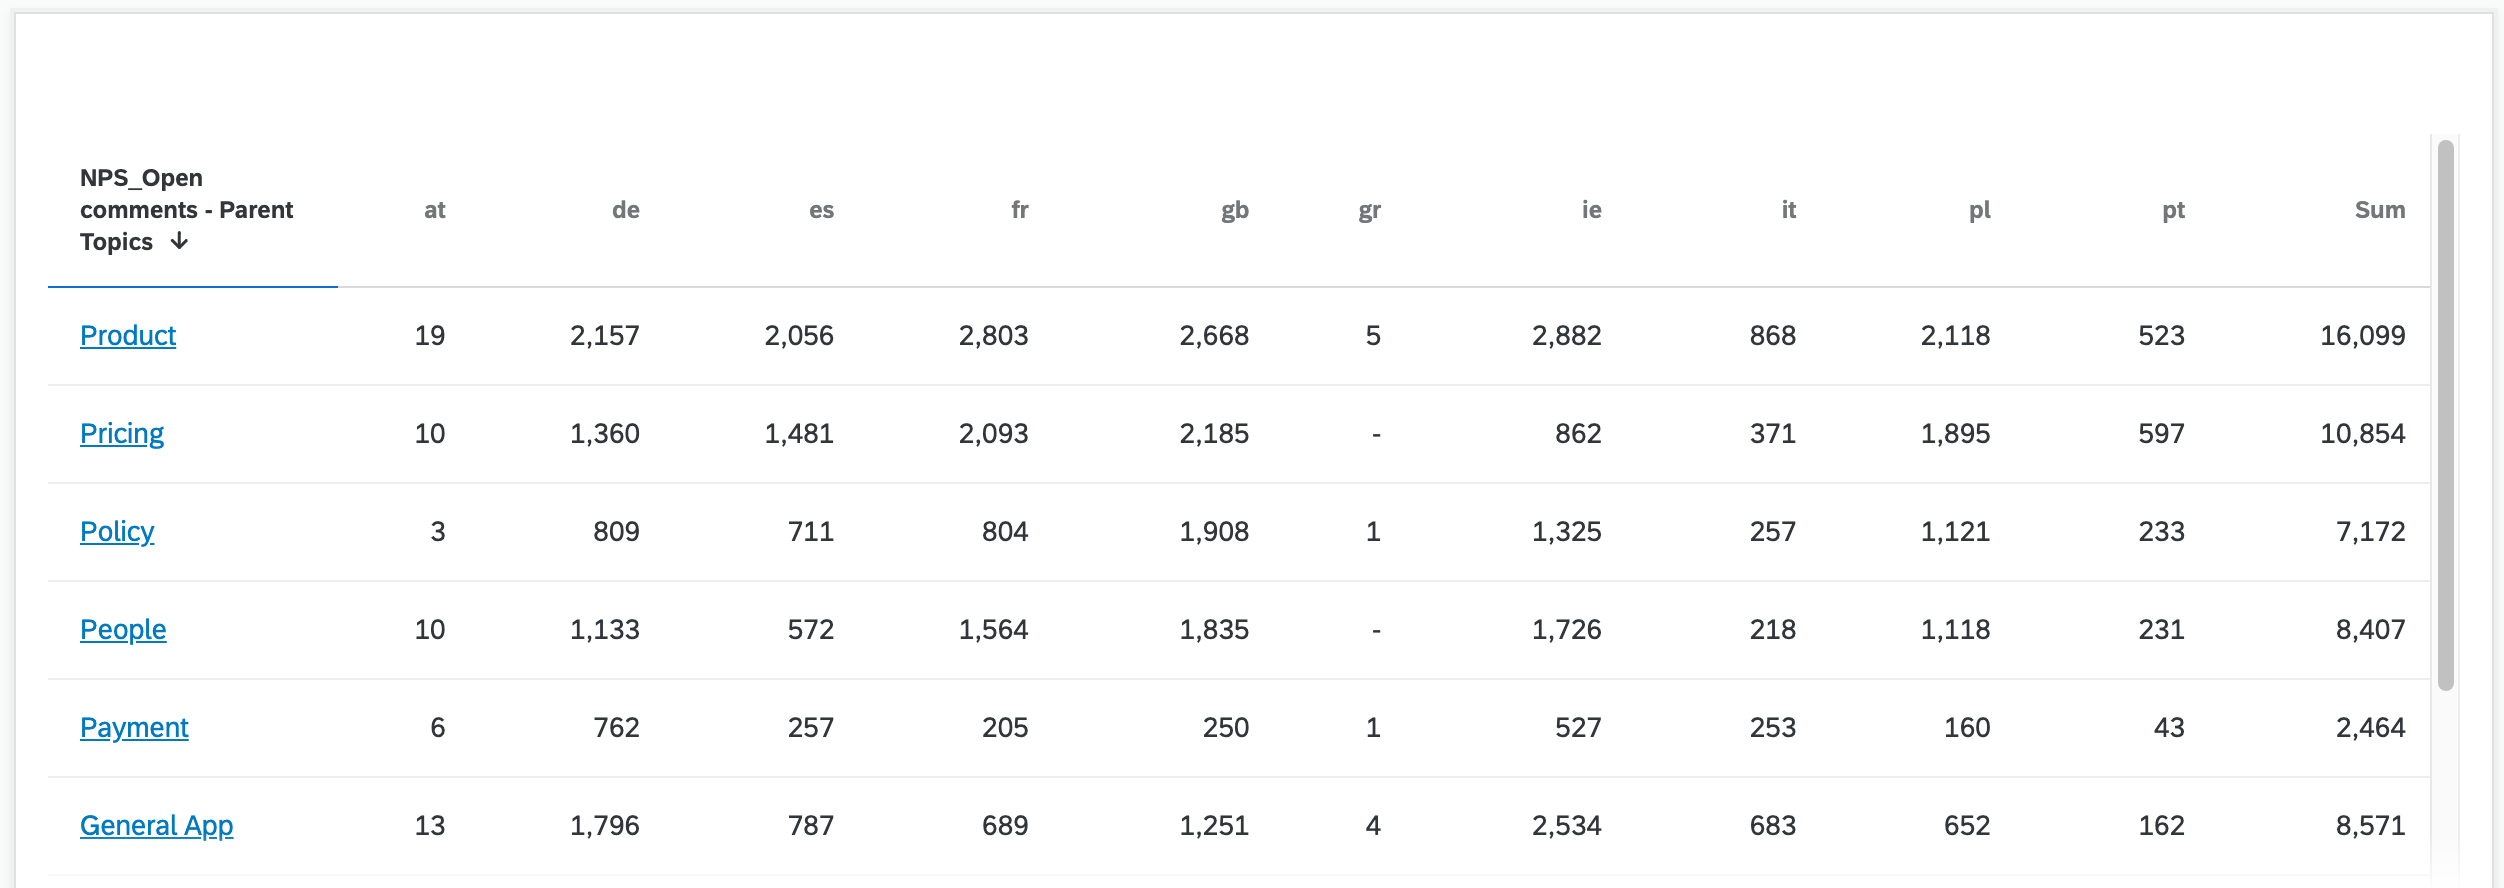
Is there a way to create a widget where "parent topics / topics" can be included and compared between different countries? Maybe it is not the Text IQ widget (there is no option to include other variables as columns) but another option to do so.
Thanks!
Dashboard: Text IQ Widget - How to analyse data pero other variables: countries
Sign up
Already have an account? Login

Welcome! To join the Qualtrics Experience Community, log in with your existing Qualtrics credentials below.
Confirm your username, share a bit about yourself, Once your account has been approved by our admins then you're ready to explore and connect .
Free trial account? No problem. Log in with your trial credentials to join.
No free trial account? No problem! Register here
Already a member? Hi and welcome back! We're glad you're here 🙂
You will see the Qualtrics login page briefly before being taken to the Experience Community
Login with Qualtrics

Welcome! To join the Qualtrics Experience Community, log in with your existing Qualtrics credentials below.
Confirm your username, share a bit about yourself, Once your account has been approved by our admins then you're ready to explore and connect .
Free trial account? No problem. Log in with your trial credentials to join. No free trial account? No problem! Register here
Already a member? Hi and welcome back! We're glad you're here 🙂
You will see the Qualtrics login page briefly before being taken to the Experience Community
Login to the Community

Welcome! To join the Qualtrics Experience Community, log in with your existing Qualtrics credentials below.
Confirm your username, share a bit about yourself, Once your account has been approved by our admins then you're ready to explore and connect .
Free trial account? No problem. Log in with your trial credentials to join.
No free trial account? No problem! Register here
Already a member? Hi and welcome back! We're glad you're here 🙂
You will see the Qualtrics login page briefly before being taken to the Experience Community
Login with Qualtrics

Welcome! To join the Qualtrics Experience Community, log in with your existing Qualtrics credentials below.
Confirm your username, share a bit about yourself, Once your account has been approved by our admins then you're ready to explore and connect .
Free trial account? No problem. Log in with your trial credentials to join. No free trial account? No problem! Register here
Already a member? Hi and welcome back! We're glad you're here 🙂
You will see the Qualtrics login page briefly before being taken to the Experience Community
Enter your E-mail address. We'll send you an e-mail with instructions to reset your password.


 Doing so it is possible to check which categories are the most important comparing countries. Also, do you know if its possible to include a comparison about how it has changed each of this row vs last 30 days or previous month?
  Also, and a similar question than before, do you know if its possible to include a comparison about how it has changed each of this row vs last 30 days or previous month? I mean, to include a kind of 'evolution' comparison, any idea? Thanks!