Hello awesome community of users!
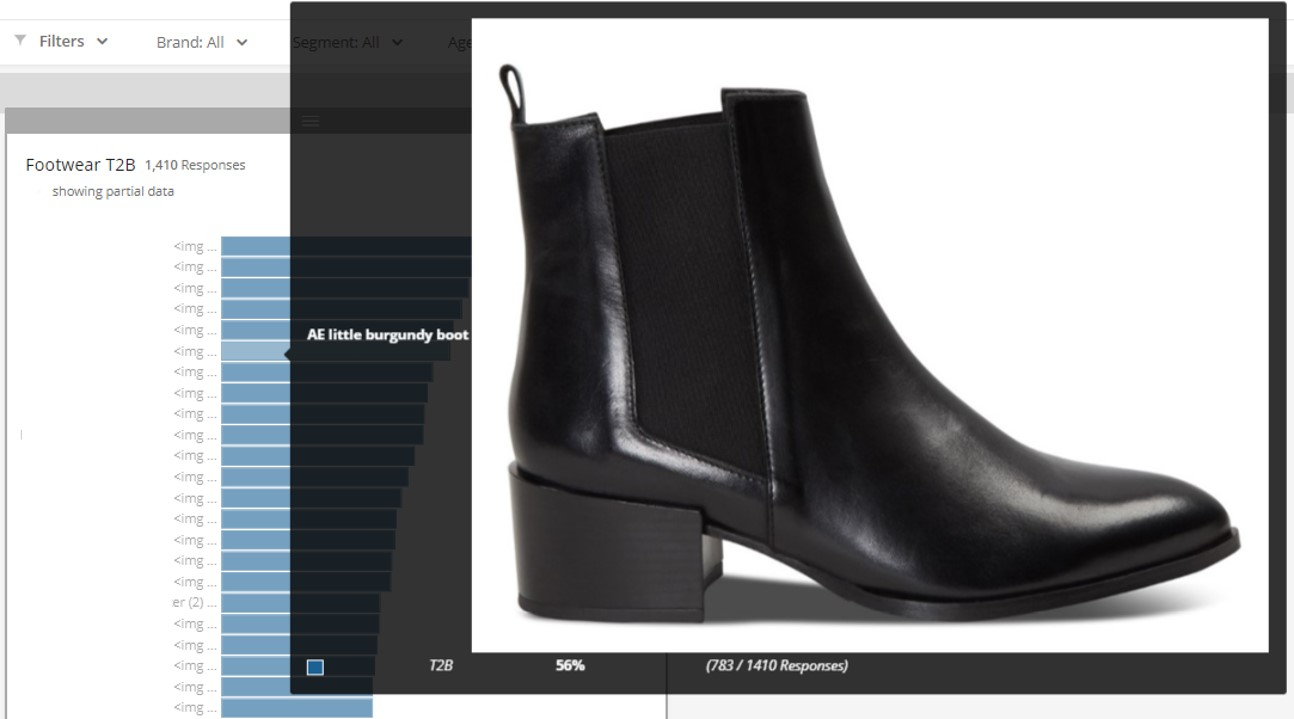
In one of my surveys, we show a bunch of images to rate. In my dashboard, I'm showing the % of people who checked each image, but the name is quite confusing so I'd rather display images instead of text...
In one of my widgets (simple chart), I was able to "cheat" a bit and to have the image displayed when the mouse rolls over the label (by adding img src="image url" after each label). But I'm wondering if there is a simpler way, one that would display the image directly, without having to roll over the label?
Any ideas? Thanks everyone!
Widget for reference:
!
Hi @DaisyD, just chasing this up as am still interested to know more of the detail on this. Thanks. Rod.
@PeeyushBansal I didn't request Qualtrics to develop a custom widget, and kept my initial approach (adding HTML in my labels). Adding it through the recode editor window didn't work on my side, so I create a main widget, then update the labels, and use it as a base for other widgets. It's the easiest I could find, for now!
@DaisyD , Can you please confirm how you handled this or the best approach you followed to show images.
Thanks, it would certainly be great to be able to show the image instead of the normal text, I did have a play but it seems that url's are only parsed via the popup which is a shame.
A little while back I came across a thread (perhaps on stackoverflow) that showed it was possible to control the colour of the font in a widget by injecting HTML code in the recode editor window (where you have a list of labels) within the settings page of the dashboard. I've not been able to find the page but having a quick play now, it does look like the fields there are HTML active for as soon as you write `<font color=#ff0000` and then type `>`, the code is removed.
Have you tried referencing an image via this way or more simply changed the font colour of the recoded label?
Thanks
Rod
Not sure why my code doesn't show? It's this:
```
IMAGE NAME <img height="200"src="URL OF IMAGE">
```
```
IMAGE NAME <img height="200"src="URL OF IMAGE">
```
Hi @Rod_Pestell
I had to manually change the labels for my widget, which was a bit painful but made the understanding of my charts easier by our C-Suite so it was worth it.
I also tweaked it a bit since posting my question, to adjust the image size directly and not have huge image when rolling over the label (ex: Name of my image <img height="200"src="url of image here">)
I reached out to Qualtrics Dev and they told me the only way to have the image displayed directly without roll-over would be to develop a custom widget...
Hope this helps!
Hi, so you are currently using the popover feature to display the URL? Interesting idea and something I didn't realise you could do but I guess this is rather manual for each widget. Or did you add the html code within the dashboard settings page?
I guess that you are trying to recreate what excel chart does by replace the fill colour with an image?
Perhaps you could create a mock-up to show what you want to get to? I can't promise to provide an answer but with more info perhaps someone on the site can offer more help.
Thanks
Rod
I guess that you are trying to recreate what excel chart does by replace the fill colour with an image?
Perhaps you could create a mock-up to show what you want to get to? I can't promise to provide an answer but with more info perhaps someone on the site can offer more help.
Thanks
Rod
Leave a Reply
Enter your username or e-mail address. We'll send you an e-mail with instructions to reset your password.