Help with filters on dashboards | XM Community
Skip to main content

Hi community, 


I am creating a graph that is using a question as a filter. 

The graph is displaying the different benefits. Let’s say we have 100 responses. 

The question we are using as a filter is about gender. Let’s say we have 50 responses. 


when i create the graph and filter it by gender. I only see the 50 responses. How can i also show the responses where we don’t have gender? 


Thank you! 

Hello @Bebesa

My suggestion would be to incorporate two separate widgets positioned side by side. Apply a filter (such as Gender) to one widget, while leaving the other widget without any filters. This setup will allow you to view the filtered data in one widget, while the adjacent widget displays all data.

Let me know if this helps.


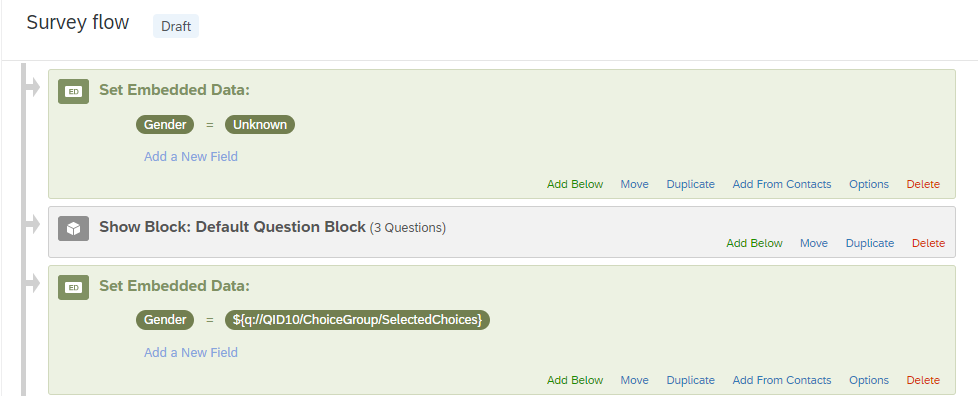
I do this by assigning “Unknown” value to records where it’s empty in the Survey Flow. Since this is a question for you, create an Embedded data field where you will assign the answer from the question, and then a branch if it’s empty, assign “Unknown”. You can manually assign Unknown to empty records in Data & Analysis that you already collected.


Thank you both for your quick reply ! @Sachin Nandikol  I am currently displaying them the way you mentioned above. 

@InessaG Can you share some screenshots on how to do that ? 


Here is a quick example. I’m setting up the embedded data field with “unknown” value. And after the question is answered, I’m setting it to the answered choice. So if they didn’t answer, it’ll have the original value of Unknown.


Leave a Reply