Quarterly Survey > How to create a 'Quarter' date new field based on current 'dates' fields in Data & Analysis tab
Hi Qualtrics colleagues,
We have built a survey that is launched quarterly. First wave was launched on last April’23 and next wave will be launched now in July’23. Next wave is expected to be launched on next October’23.
We would like to know if there is a way to build trend widgets so let us to compare results in a quarterly based. It means, we’re interesting on comparing results Q3’2023 vs Q2’20203 and so on. Also, not only for the trend graphs but also in the number widgets and rest of them
Is there a way to create a new ‘date field’ that lets us to compare results quarter by quarter? For instance creating a new field in ‘Data Analysis’ tab that identifies which quarter each interview belongs to.
The main goal is creating also as a new field coded as ‘date format’ or at least that can be coded as ‘date format’ in the dashboard to work with accordingly.
Thanks for your support!
Page 1 / 1
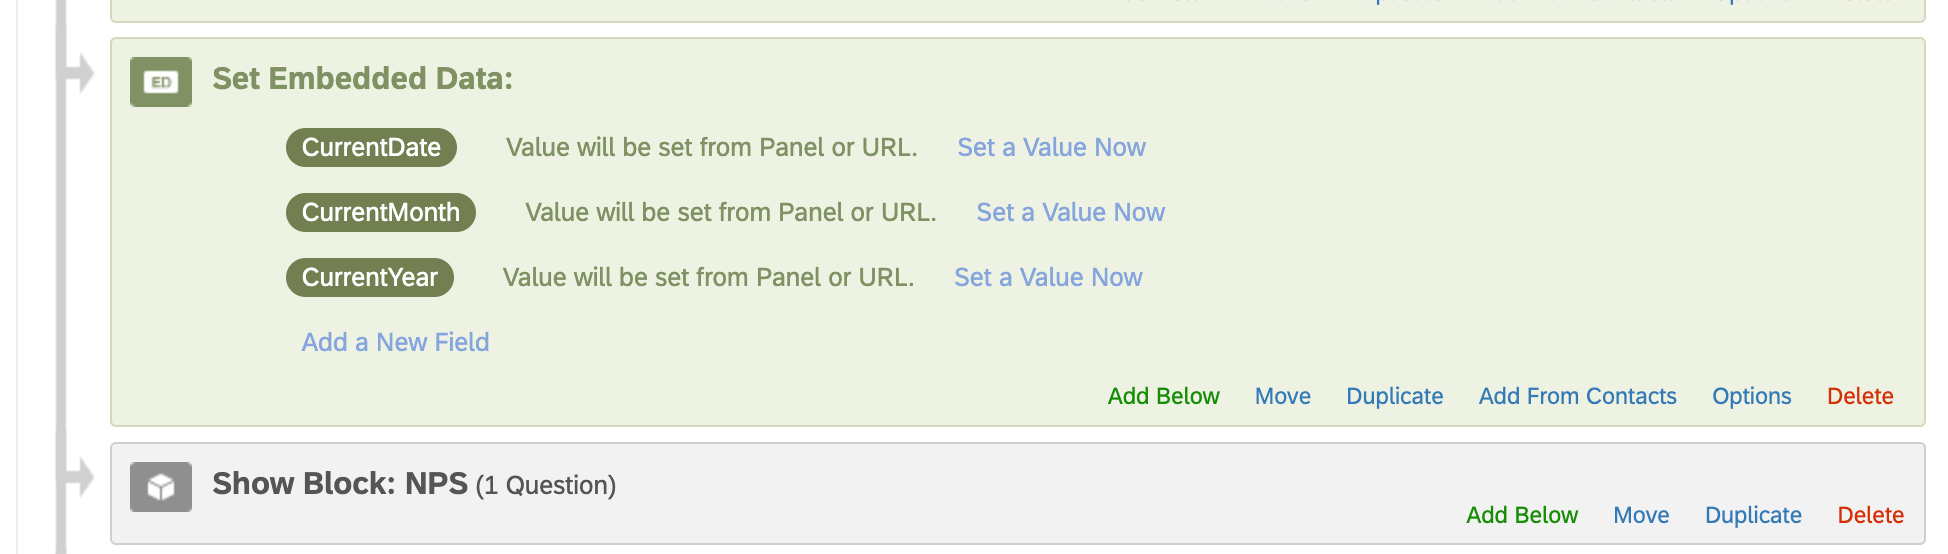
You can create three embedded fields to capture date, month, and year. Field name should “CurrentDate, CurrentMonth, CurrentYear” and paste below code in your very first question of the survey.
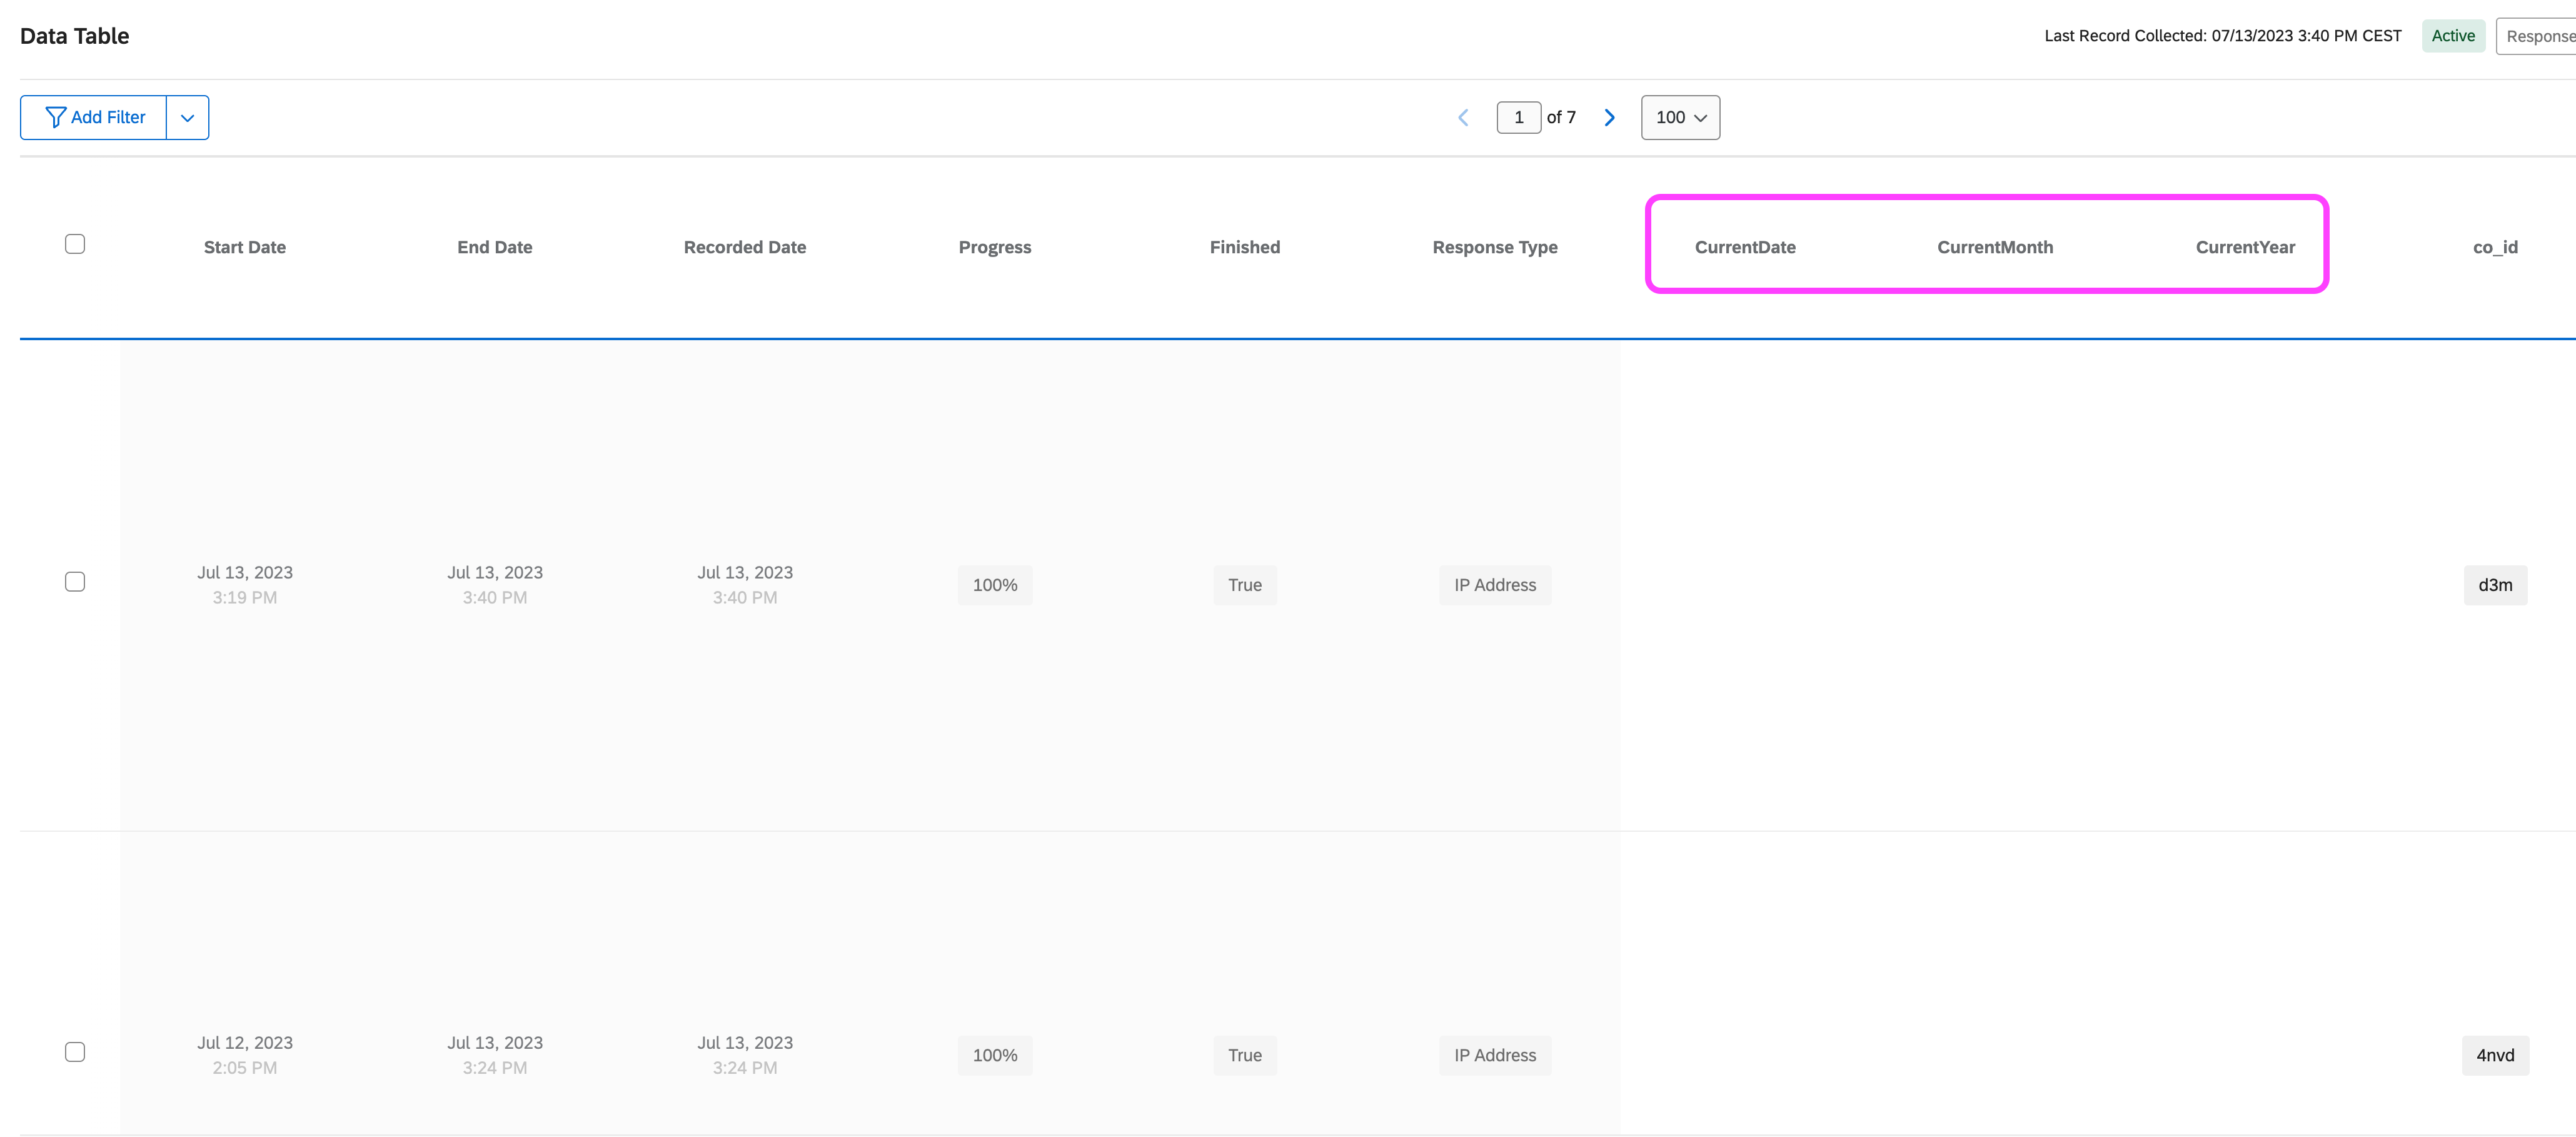
CurrentDate will capture “07/2023”, CurrentMonth will capture “07” and CurrentYear will capture 2023. Then you can use these field under survey.
Qualtrics.SurveyEngine.addOnload(function() { /*Place your JavaScript here to run when the page loads*/ var today = new Date(); var Month = String(today.getMonth() + 1).padStart(2, '0'); //January is 0! var Year = today.getFullYear();
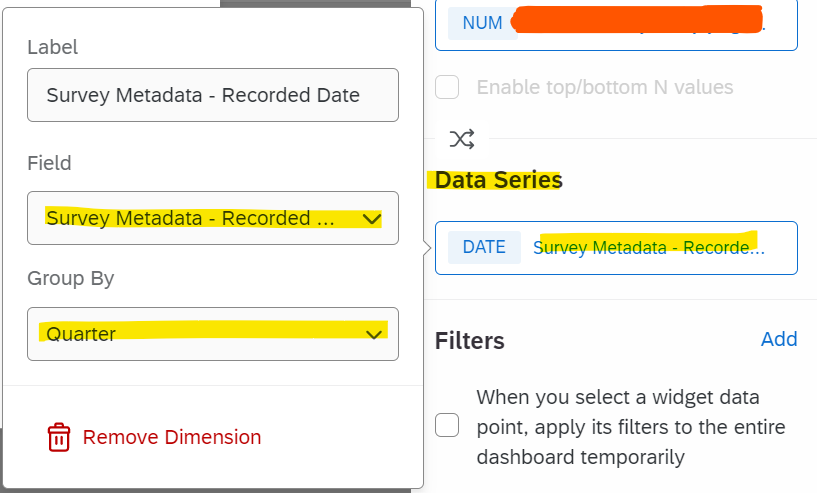
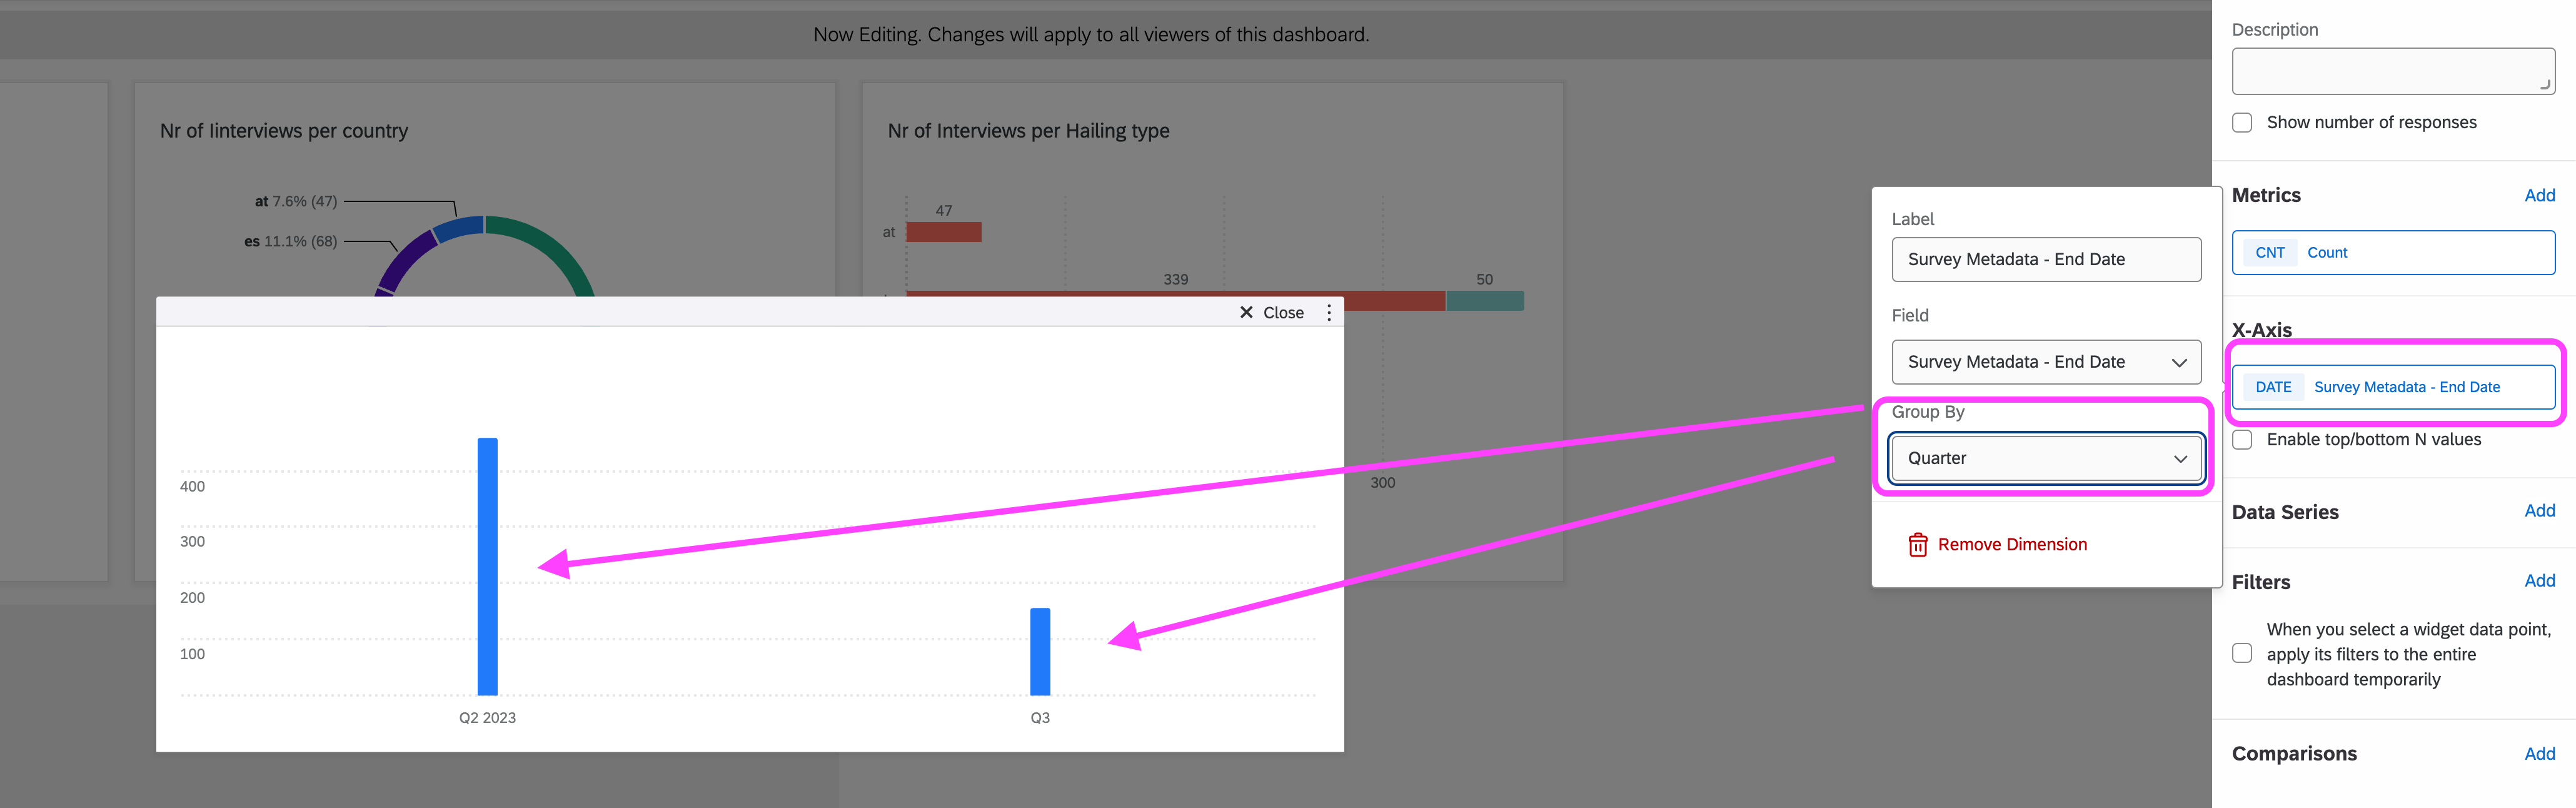
Secondary, you can directly use record date as each widget segment (data series) in your dashboard and represent the data quarterly basis. Please refer below option.
Hi @ArunDubey, thanks for your feedback.
I’ve recently added the 3 fields in the survey flow:
And also in the 1st question (NPS question):
Do you know if it’s possible to have this data for the past interviews or this is only possible by downloading, filling up this information manually and uploading again?
Thanks!
@ArunDubey it seems it also applies for previous interviews, correct? I’ve already applied it for a widget which counts the number of interviews:
Yes, second method will work on all old and new responses. If you just want to represent your data. so better go with this method only.
@ArunDubey it seems it also applies for previous interviews, correct? I’ve already applied it for a widget which counts the number of interviews:
But for first method, you will need to edit embedded data field API to punch the previous response or you will need to download/edit/upload process to update previous responses.
This 2nd method is the way we’d like to analyze the data.
When you refer to the 1st method, what is your referring to?
I was referring JS code and then edit previous embedded data for Month, year and dates.
ok, thanks! probably will do both to have this information also included for the old ones. thanks!