Reporting summed results in binned ranges | XM Community
Skip to main content

I have a scored matrix question (the K10 Kessler distress scale)

I have managed to generate a report that sums individual scores for the entire matrix and graphs individual total scores.

What I want to do is report total number of scores that fall in a given range:

Total scores 1-19, 20-24, 25-29 and 30-50.

How do I do that?

@Dr_CFB I’m assuming you’re using dashboard.

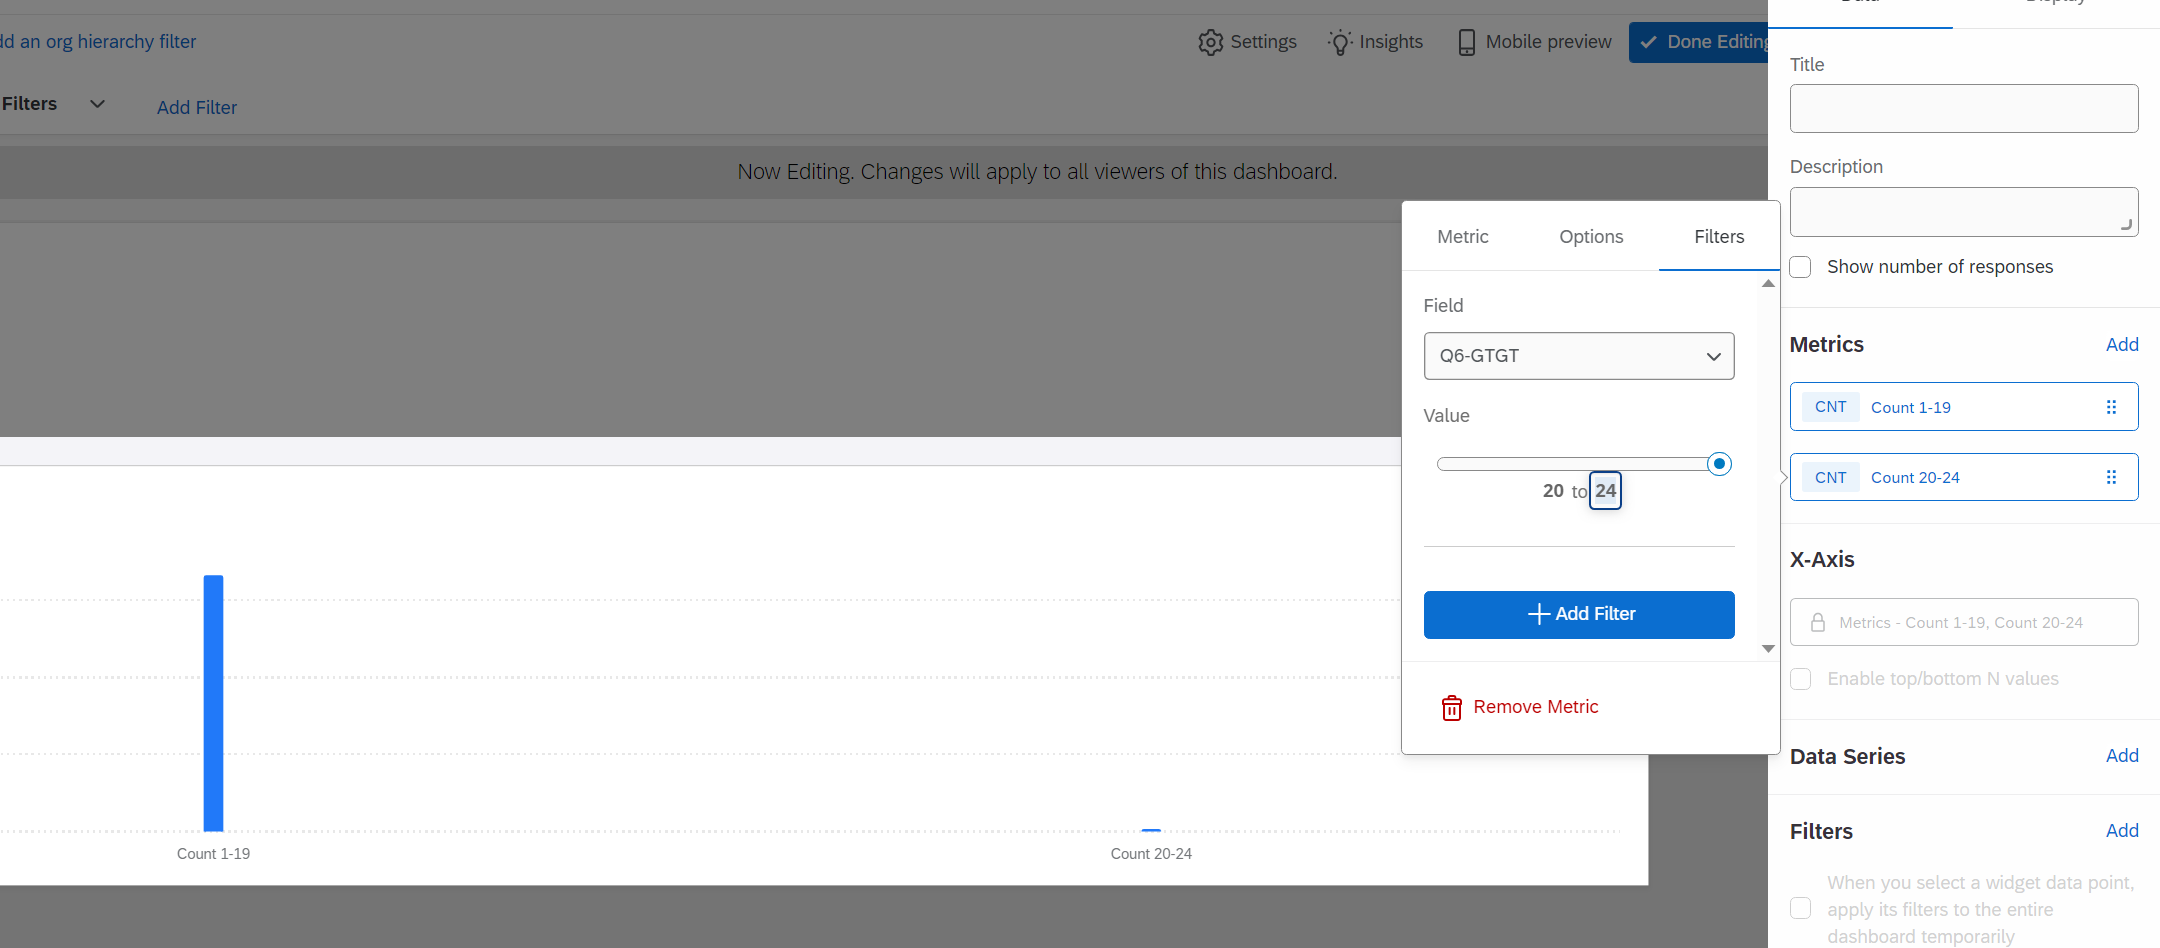
  1. You can add filter into each COUNT metric that you add, set the number range to yours. That’s the lazy way. And should work in some kind of widget like barchart…..
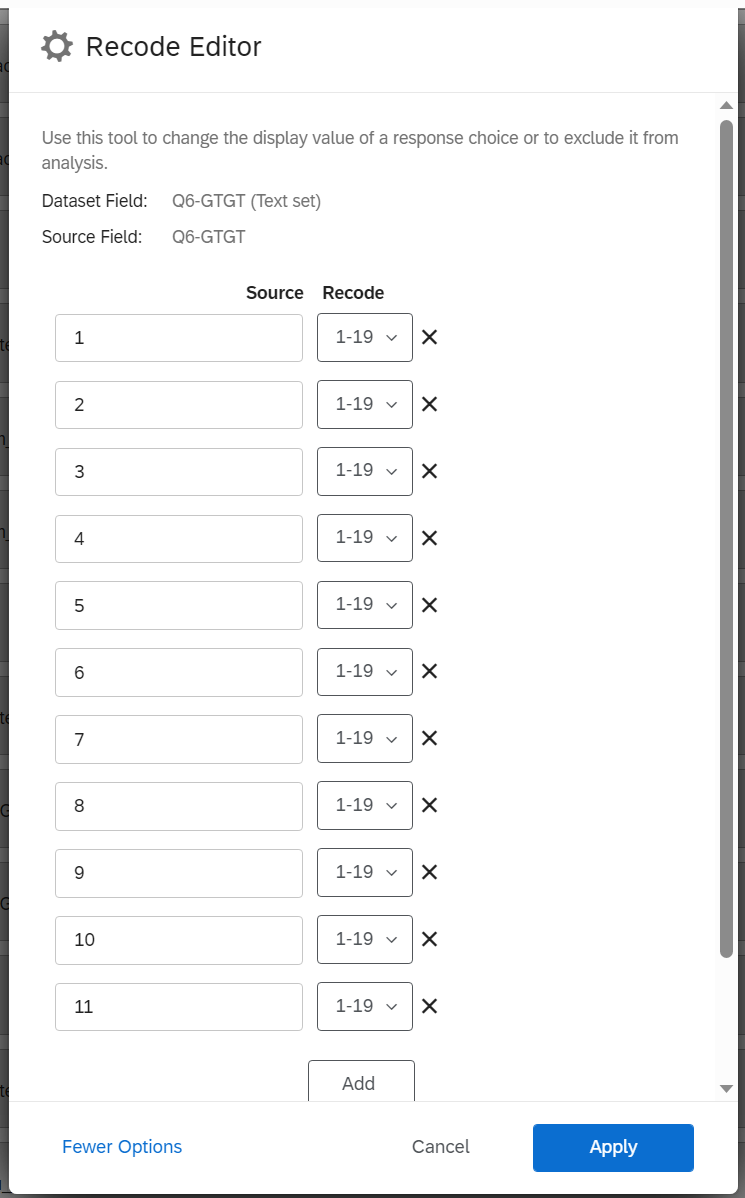
  1. Another better way is to Recode value in Data mapping to bucket your score to a new textset field. Recoding Dashboard Fields (CX) (qualtrics.com). Then you can use this bucketed field anywhere.


Leave a Reply