On a CX dashboard widget, is it possible to show how many responses fall within a range? So out of 100 points, how many fall between 90-100, 80-89.9, etc? Ideally, the ranges would be rows, rather than a filter on the entire widget.
Additionally, I need to average the scores gained from individual respondents, and roll those up to the ranges above. I started to use a custom metric for this, but got stuck once I couldn't use it to filter. (This step is why I don't think embedded data will work for the first step)
As background, I've been able to do this in Data Studio, but I used CASE logic to create the ranges. I'm trying to figure out if you can achieve something similar in Qualtrics or not.
Any help is appreciated!

Page 1 / 1
You can create a custom field (bucketing or formula) in your survey's Data & Analysis tab, and then map it into your dashboard. That should then give you the desired behavior, I believe.
I also like using a simple chart and creating Top Box/Bottom Box metrics to show the ranges. I was only using a 5 pt scale here, but you can define a range. 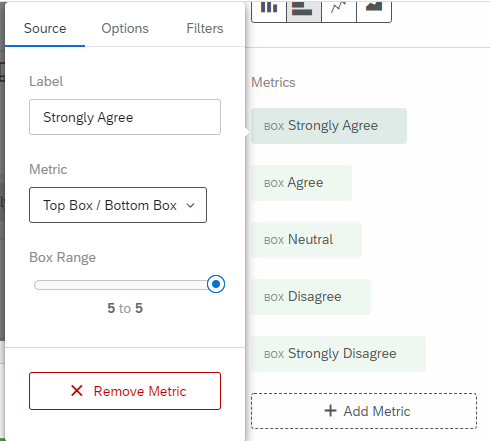 The widget looks like this:
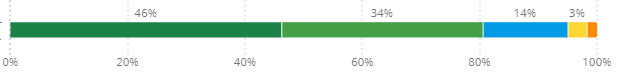 Maybe this is what you are looking for.
Sabrina
Thank you InessaG ! I didn't even know that section existed, that's really helpful.
SabrinaC - I really like the idea of using TopBox/BottomBox for this - do you happen to know if there's a trick that would let you use TopBox/Bottom box with a calculated metric?
Katie_Colibri - See if this helps, Custom Metrics (CX)
Leave a Reply
Enter your E-mail address. We'll send you an e-mail with instructions to reset your password.