HI community! In a Table widget in a CX Dashboard, I want to use the Significance Testing option to compare the Compare current value to another value. However, the results looks strange.
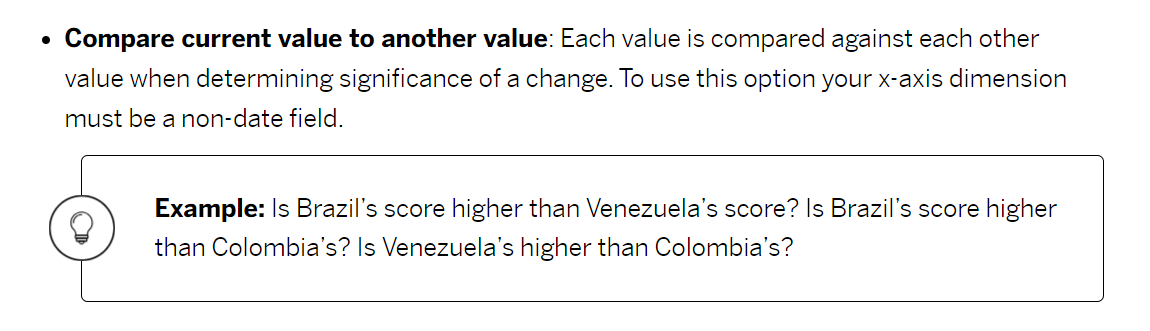
In the documentation, it states that each value is compared against each other value when determining significance of a change.
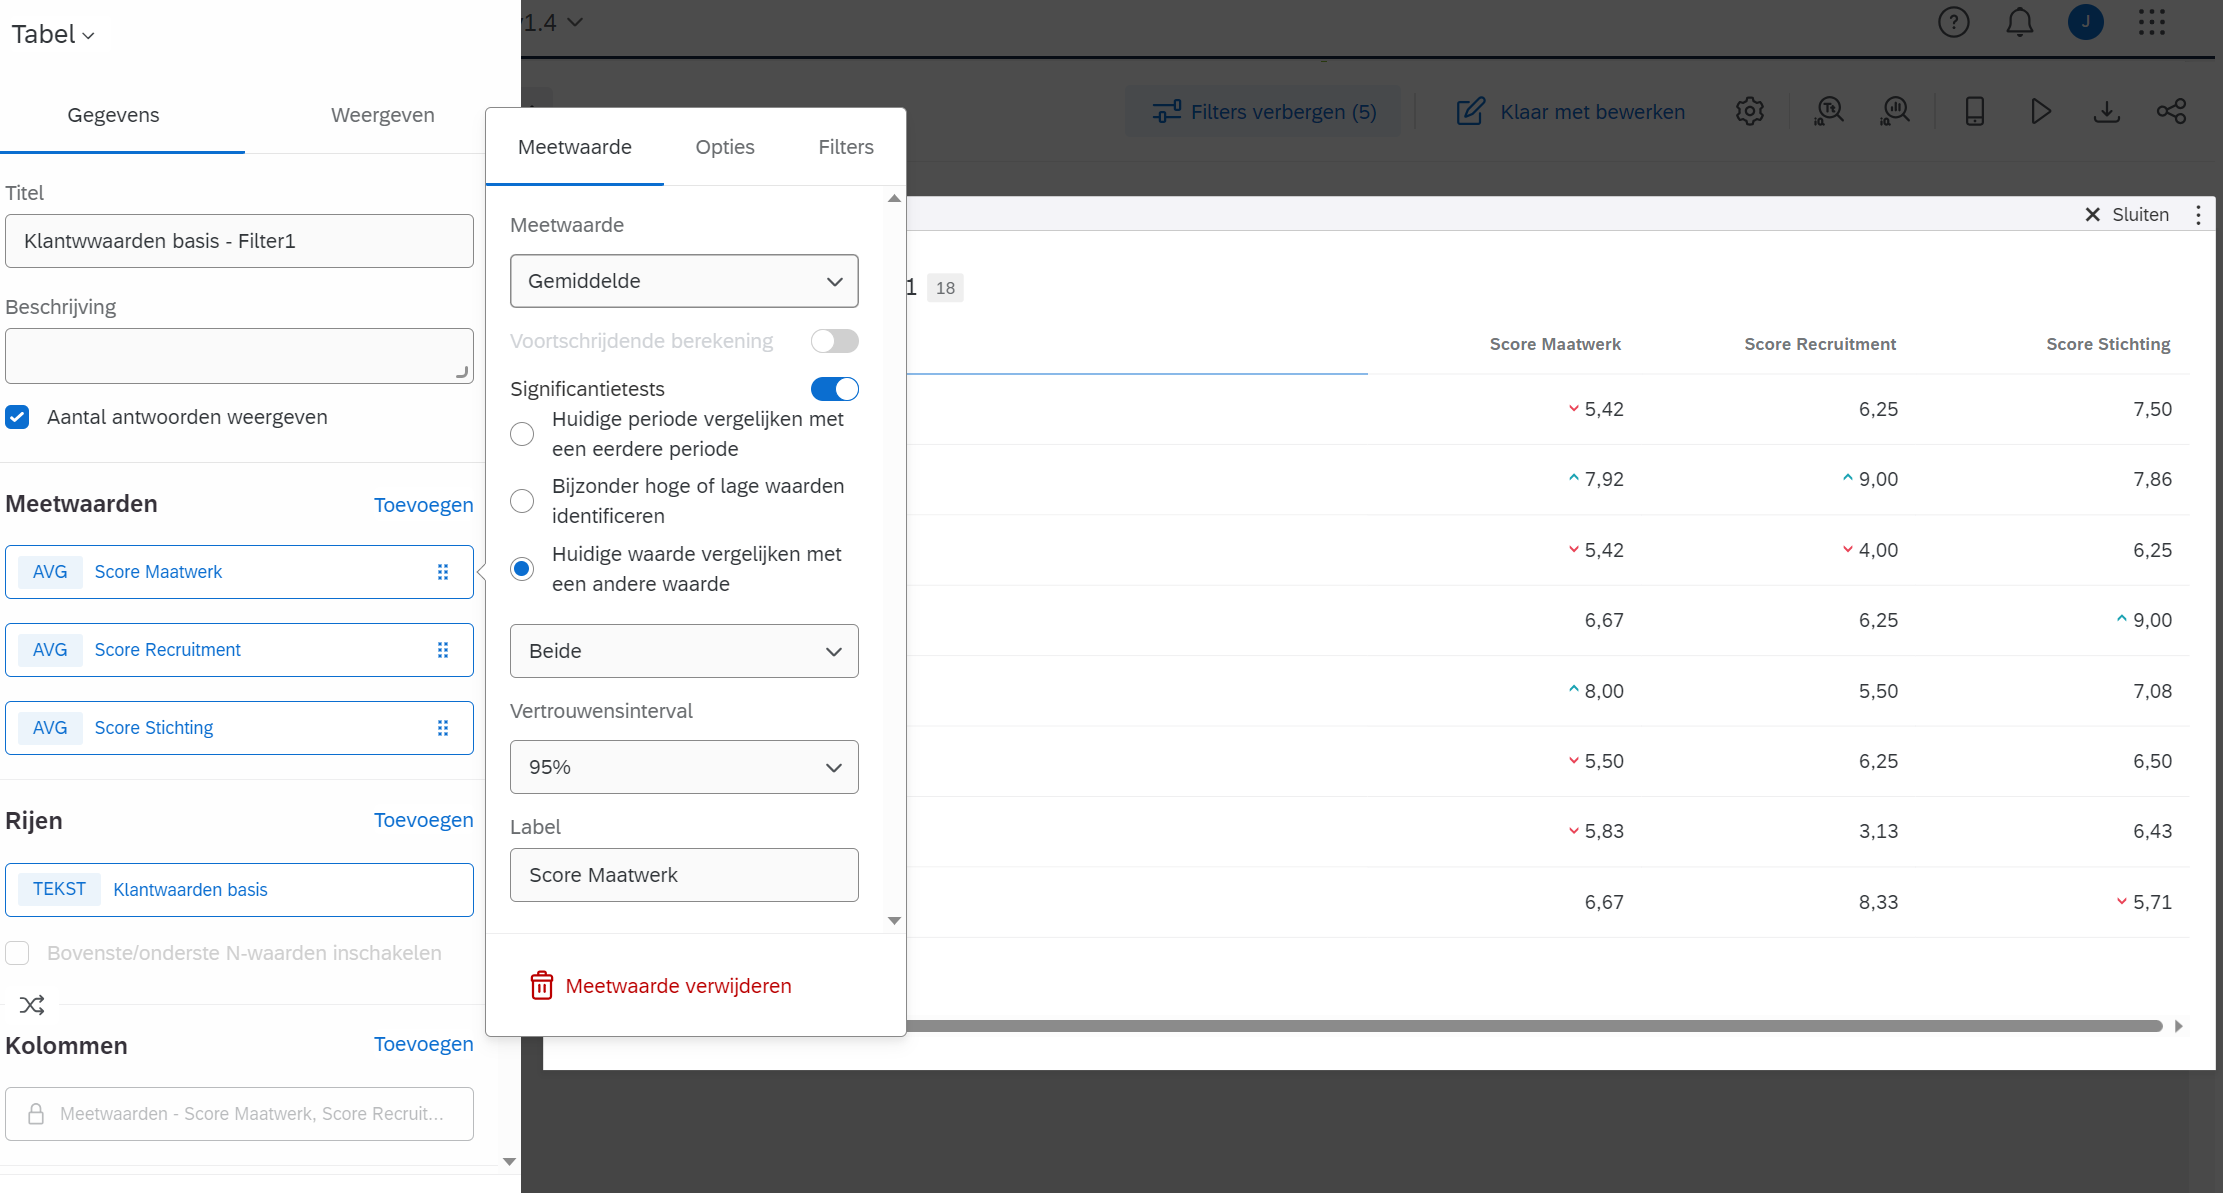
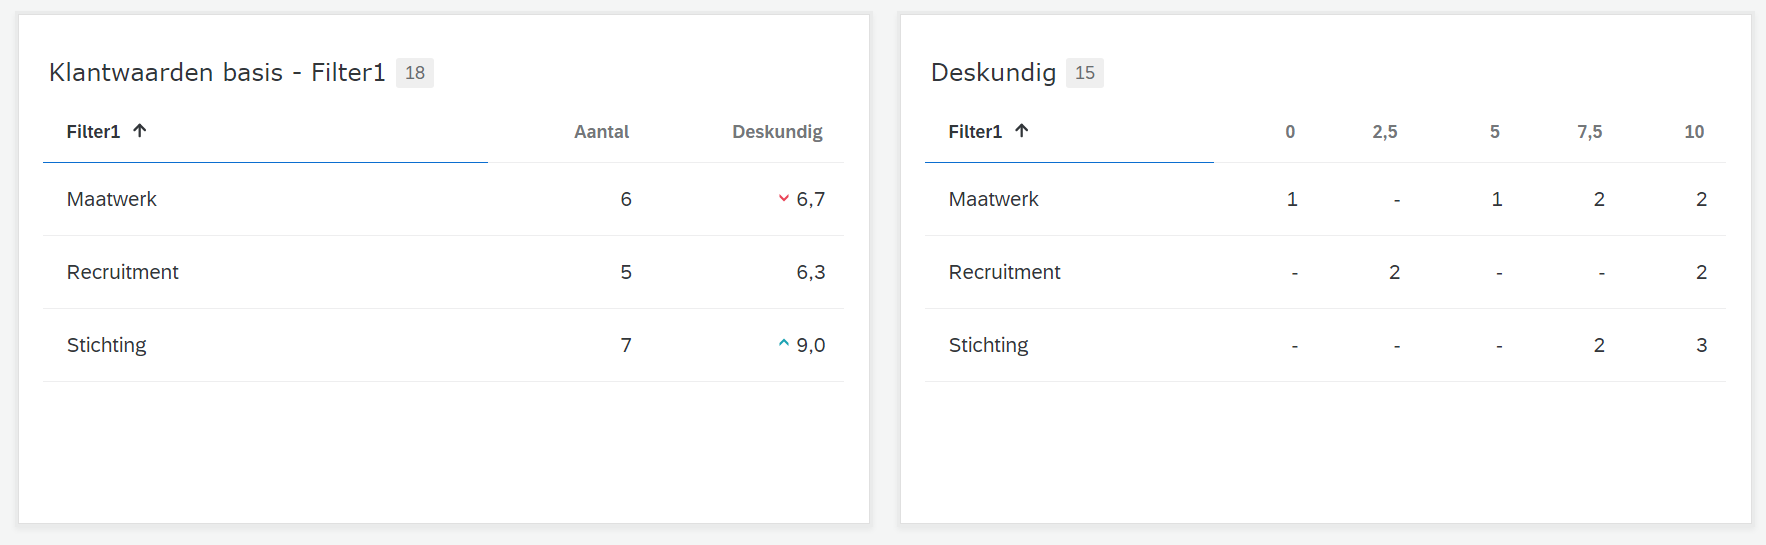
In my table, I have three filtered averages on a 10-point scale in the columns, and a group of variables in the rows.
As you can see, even though for all three columns I selected the same Significance Test, the results are not what one would expect. Why?
Best answer by ManfredBM
I don’t think it’s “documented” anywhere in the Qualtrics support material (and I also don’t think it should be mentioned there). The concept of significance testing can be found in any statistical text book. And independent of which exact algorithm / test Qualtrics uses, statistical significance is always highly influenced by the base size.
In your example with your 10-point scale, even differences in the mean score of 0,01 can be significantly different when using a large enough base size.
When you search for “t-test” on google, you will find one of the possible formulas. There’s a “sqrt(n)” in the formula. So base size (n) does not have a linear effect, but it still has quite a big effect.
it looks like the significance testing is currently done by comparing all scores in one column (rather than for one row, as you obviously want it to be).
If so, you might have to switch columns and rows in your widget.
it looks like the significance testing is currently done by comparing all scores in one column (rather than for one row, as you obviously want it to be).
If so, you might have to switch columns and rows in your widget.
Manfred
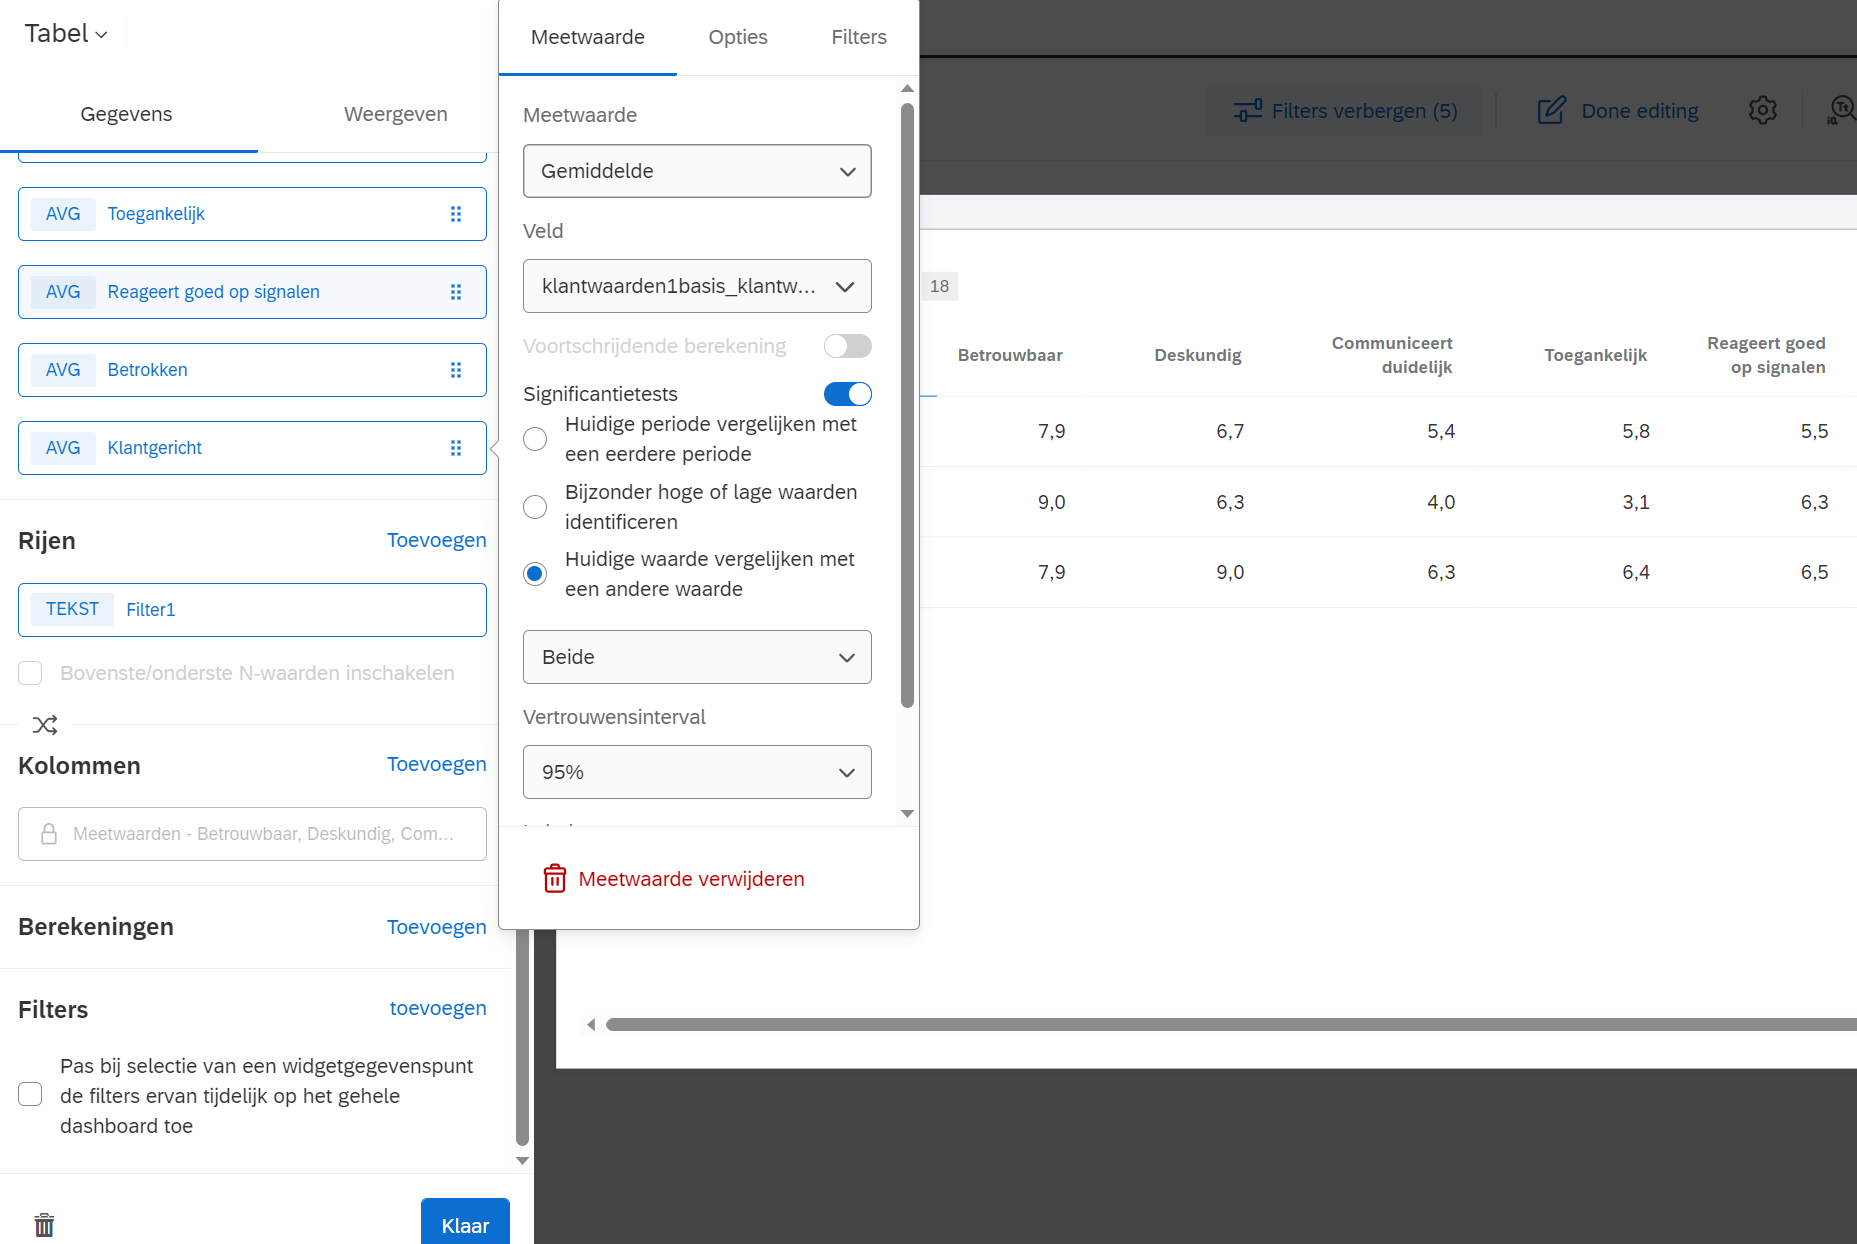
Ah, I see. Bu when I switch them, there is no comparison, even though the option is on:
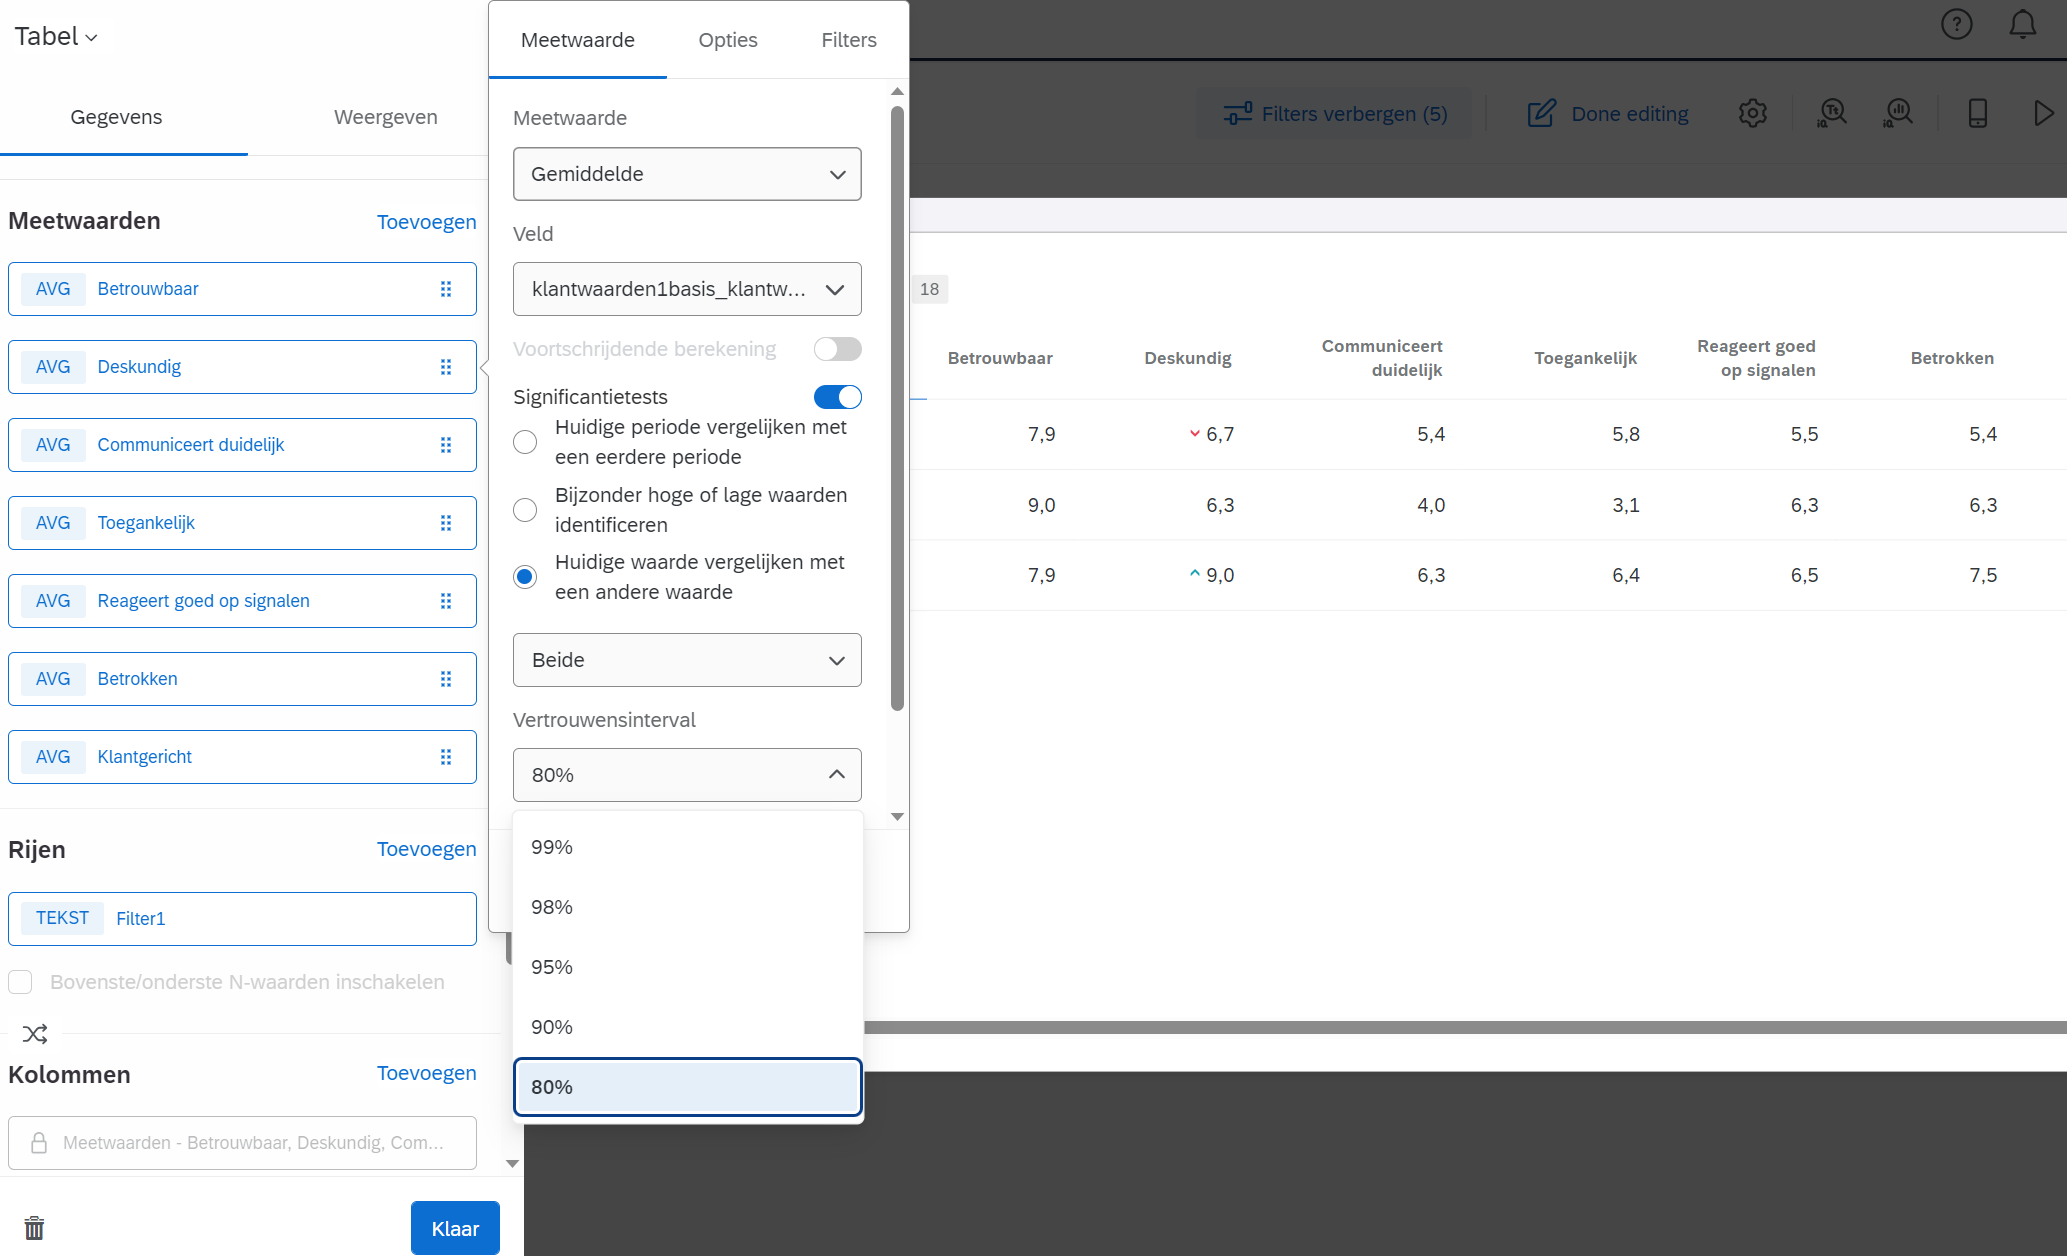
Oh, actually when I put the conficenceinterval to 80% There are 2 arrows, but only on “Deskundig”. I wonder how the calculation works, because 6.7 does not seem significantly lower in that column?
Yes, this difference in base sizes explains, why the 6,7 is significatly lower, but the 6,3 is not.
I guess you’ll get higher base sizes later on. With just a handful of responses, significance testing does not really make sense. (Though I have to admit, that in my personal opinion, significance testing hardly ever makes sense, since it’s so heavily depending on base sizes - as can be seen in your example) 😉
Last thing: so Significance Testing always works vertically, both for Identify particularly high or low values and Compare current value to another value?
btw: yes, I'll get way higher base sizes, this is just a test survey.
I don’t think it’s “documented” anywhere in the Qualtrics support material (and I also don’t think it should be mentioned there). The concept of significance testing can be found in any statistical text book. And independent of which exact algorithm / test Qualtrics uses, statistical significance is always highly influenced by the base size.
In your example with your 10-point scale, even differences in the mean score of 0,01 can be significantly different when using a large enough base size.
When you search for “t-test” on google, you will find one of the possible formulas. There’s a “sqrt(n)” in the formula. So base size (n) does not have a linear effect, but it still has quite a big effect.