Subset Ratio Output on EX Dashboard | XM Community
Skip to main content

Hello! I'm facing an issue while trying to configure a widget on an EX Dashboard.

I need to do a subset ratio using the answers that range from 1-5. Using 4,5 answers as the numerator and 1,2,3,4 and 5 as denominator. This should give me an score of the metric I'm analyzing, however the client wants it to be a range between 0-100 and it can't have the % sign besides it.

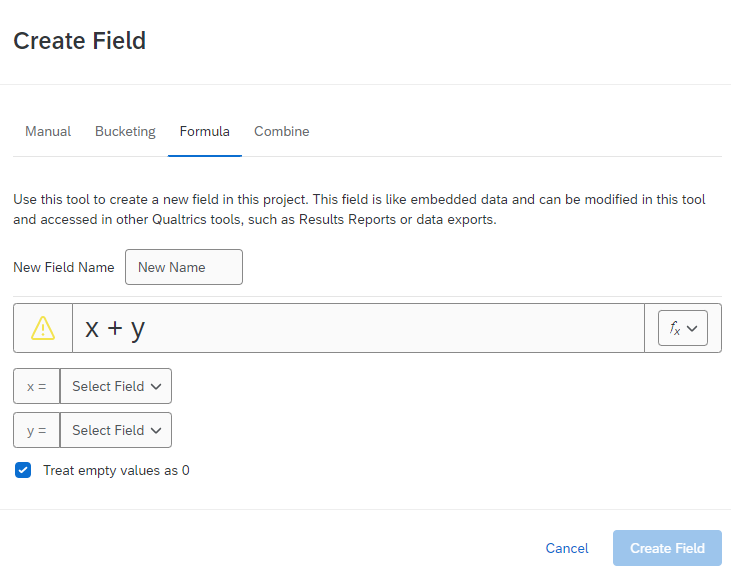
Until now, I tried adding an embedded data field that multiplies the results by 100 with math operations, trying to achieve the same result as the percentage but without the sign. No luck with that.

I also tried recoding the values in a similar fashion on the dashboard data tab. No luck with that either. Both ways are outputting a 0-1 value even when using 400 and 500 as numerator and 100, 200, 300, 400 and 500 as denominator. That result is the thing that I just can't seem to multiply by 100 without adding the % sign to it.

What am I doing wrong here?

Does anyone have any other suggestions since we can't add custom metrics to EX Dashboards? I would really appreciate it!

Thanks in advance.

Hey @NicolasPerfeito !


Have you attempted to use the Field Editor in Data and Analysis? You can assign variables to do operations etc. I believe this is what you need. For instance, the Formula section?


Hello @EricT! Thanks for your reply!

Nice to know there is another way to multiply the results! However it still didn't workout on the widget output using the subset ratio and I'm still getting a result that ranges between 0-1…

I would need a way to create a subset ratio before calculating this value in the widget maybe? Would there be a way to do this? This way I could simply command the widget to show this value instead of calculating it in the widget function itself… If that makes sense.

Thanks again! Appreciate it!


Have you tried using your embedded data values in the formula to extend their use?


Sorry it didn’t quite get you there!


Yes, Eric. The solution was to create an embbeded data field for each choice on each survey question by branching the survey flow with logics. With that, I was able to create an formula to calculate the subset ratio in a way that the scores appear from 0-100 in the EX Dashboard Widgets.


Thank you so much!

Very cool! Thanks for bringing up this situation. It is something I am looking to do as well. Two questions for you Nicolas:


  1. What happens though if someone doesn’t answer a question within a scale? No missing data will be imputed at that point. Out of curiosity, do you have a plan to tackle that?
  2. I’m also wondering if you had not collected your data prior to implementing the branching logic to record data in a certain way in the survey flow? I’ve done this before, but the limitation I’ve faced is that this can’t be done retroactively. One must implement this type of design in the survey blow prior to collecting data.

Cheers!


Pat


Leave a Reply