Hi!
I am attempting to trend text iQ data from multiple sources I have in the data source tab.
1) Is this possible?
2) How do you trend date in table text iQ when there is data from surveys from 2 points in time May 2021 and May 2022?
Thanks!
Page 1 / 1
slschloemer Hey Stephanie! It's been a while - I've left Qualtrics since we last interacted.
I'm at a new organization, Rizing (a Qualtrics Partner, go figure), and we take time (and I take personal time) to contribute to the Qualtrics Community. How lucky I found your post!
To your question, there are 7 fields that stream from Text iQ.
From a numerical field type vs. text field type perspective, the 7 fields can be broken up into:
- 2 that are strictly numerical in nature - Sentiment Polarity and Sentiment Score. These are the only ones you'd be able to display in a widget with an Average or potentially some other calculated value.
- The remaining 5, which are text-based. As a result, they can be represented via Count only, with the option to represent count as a percentage with the "Normalize Chart" option. The widget just displays a count of all the unique values coming from those fields (e.g. "Resources: 1").
From an overall vs. topic perspective, the 7 fields are split up as follows:
- 3 of the fields are analyzing the entirety of a given comment (i.e. Sentiment Polarity, Sentiment Score, and Sentiment), so you'd only be able to get the overall view from each comment and nothing down to the topic level.
- The remaining 4 fields are breaking the comment down by topic (or topics, as a comment can have more than one) as identified by their corresponding query.
On the overall vs. topic level, you can see how, for example, the Sentiment Score can differ from Topic Sentiment Score on some example data I generated when a comment matches multiple topics and has a Mixed Sentiment, so just be aware of taking that overall view.
 If you want to trend on any of this, it appears you need to set up the TextiQ analysis in both data sources. Make sure all is mapped for both sources in the "Dashboard Data" section. Then you should be able to use a number of widgets to trend on one field or another, using the distuingishing factors noted above to determine what you'd like to do. Here are a few examples of configured widgets:
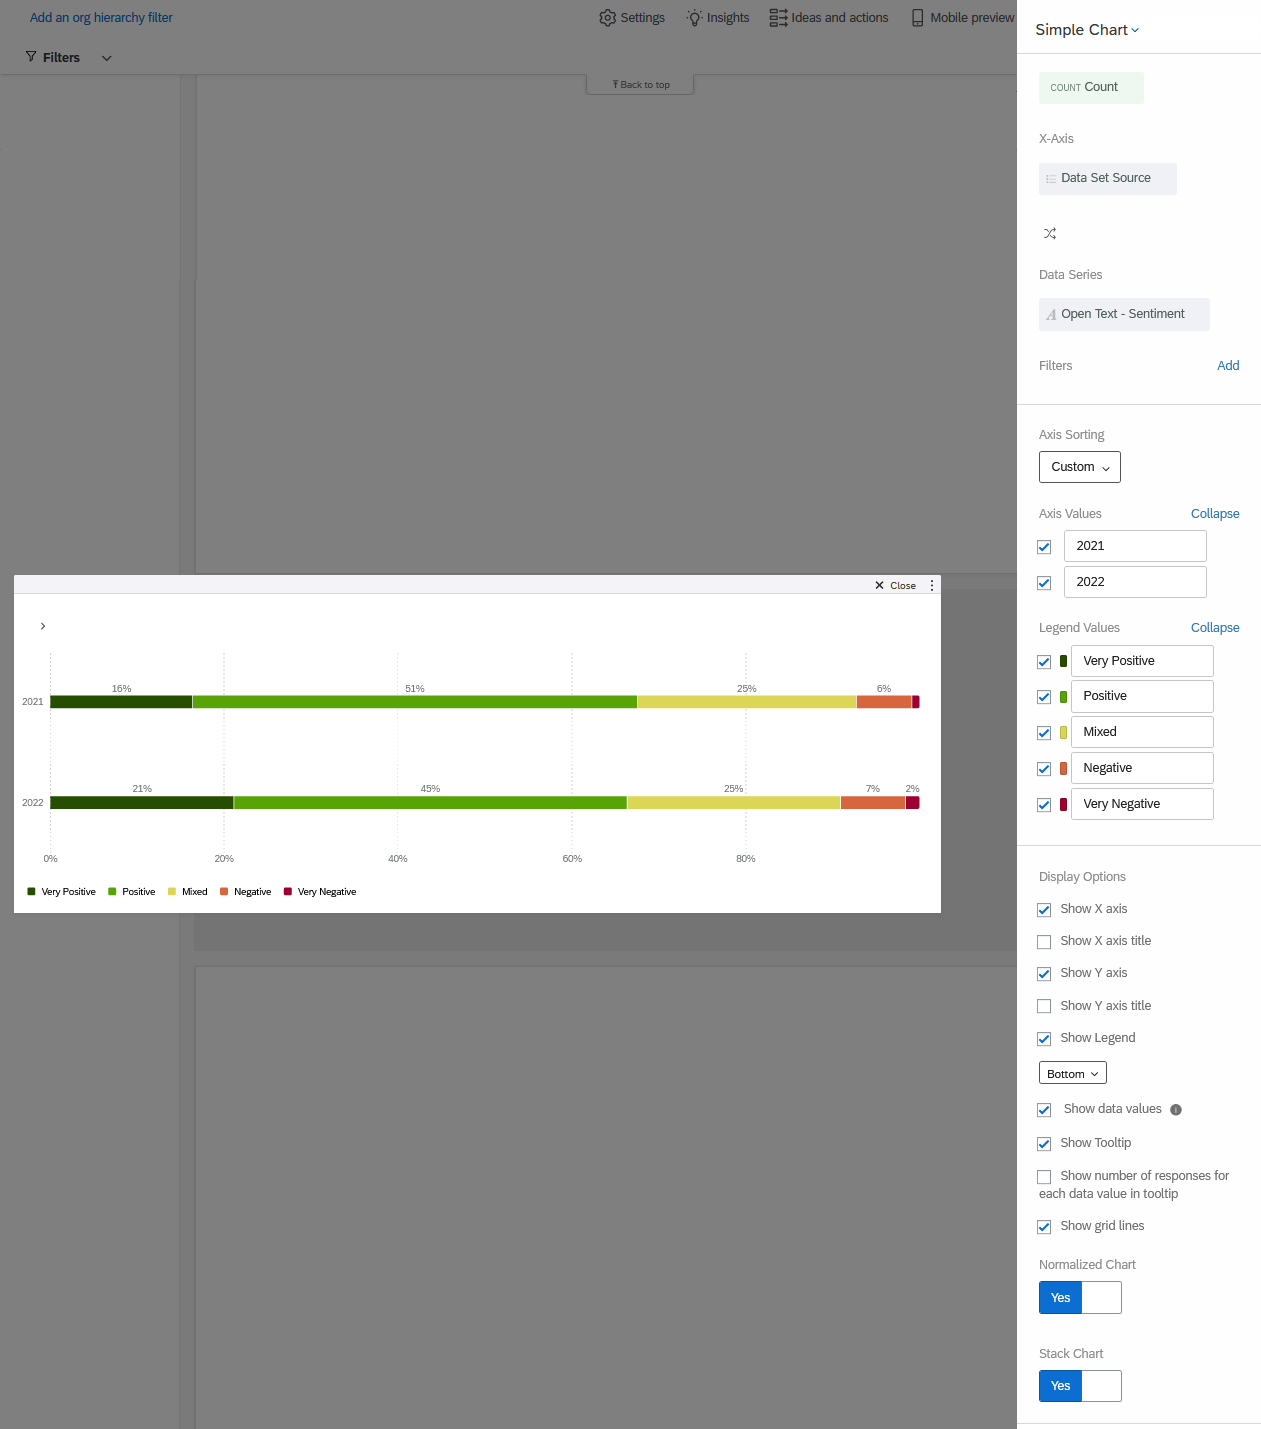
- Simple Chart widget with (Normalized) Count metric on Sentiment (text field type)
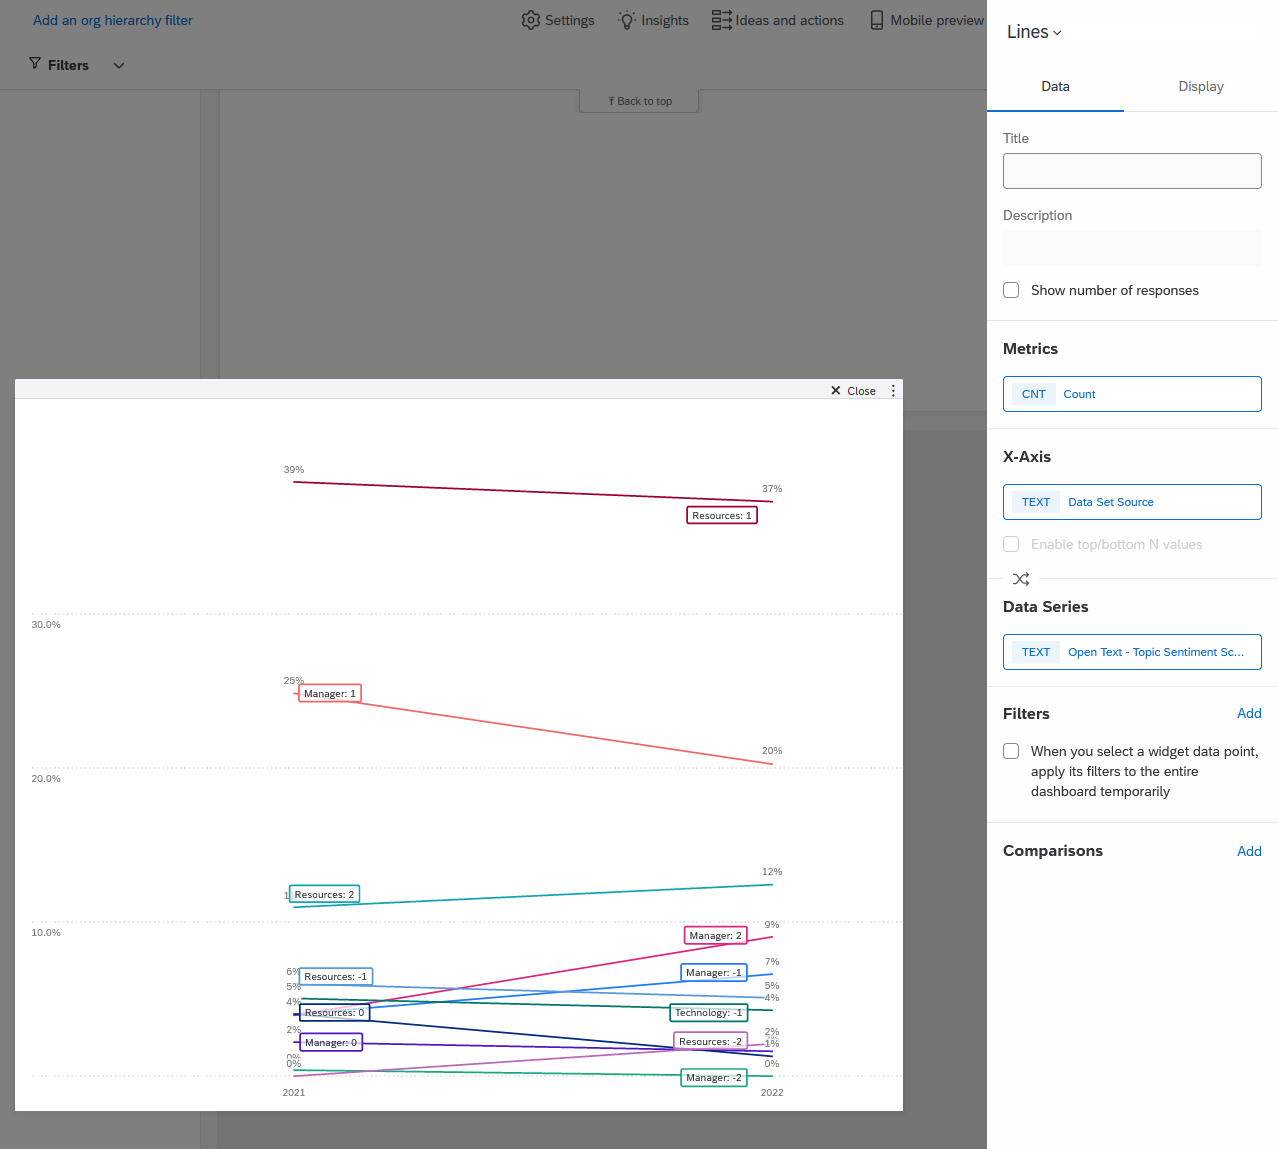
 Lines widget with (Normalized) Count metric on Topic Sentiment Score (text field type)
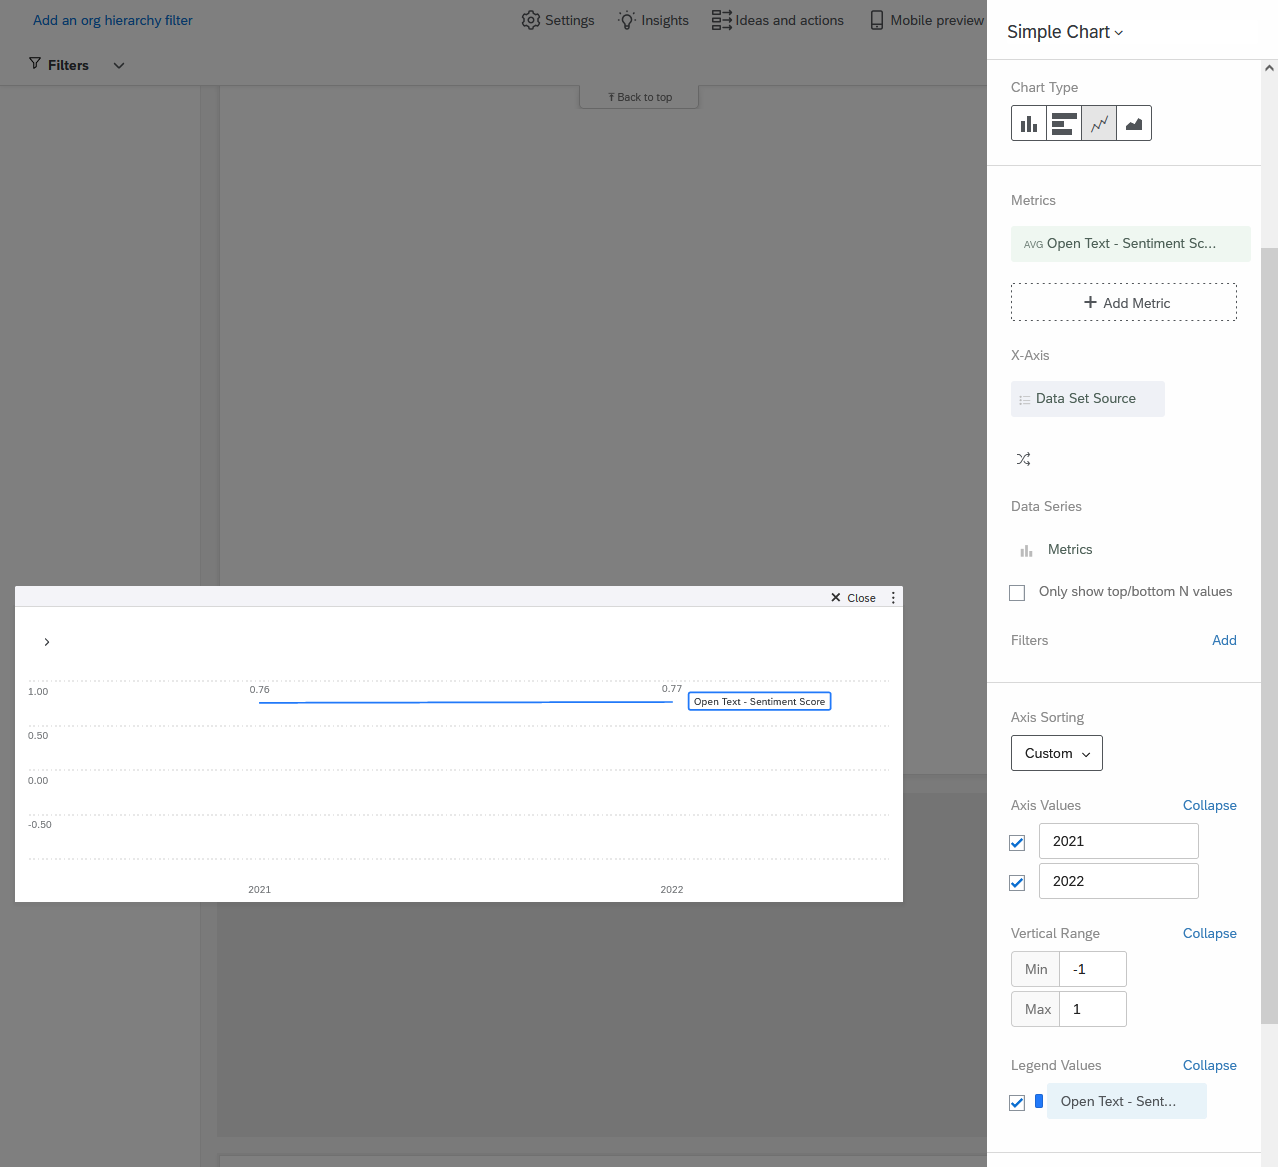
 Simple Chart widget with Average metric on Sentiment Score (numeric field type)
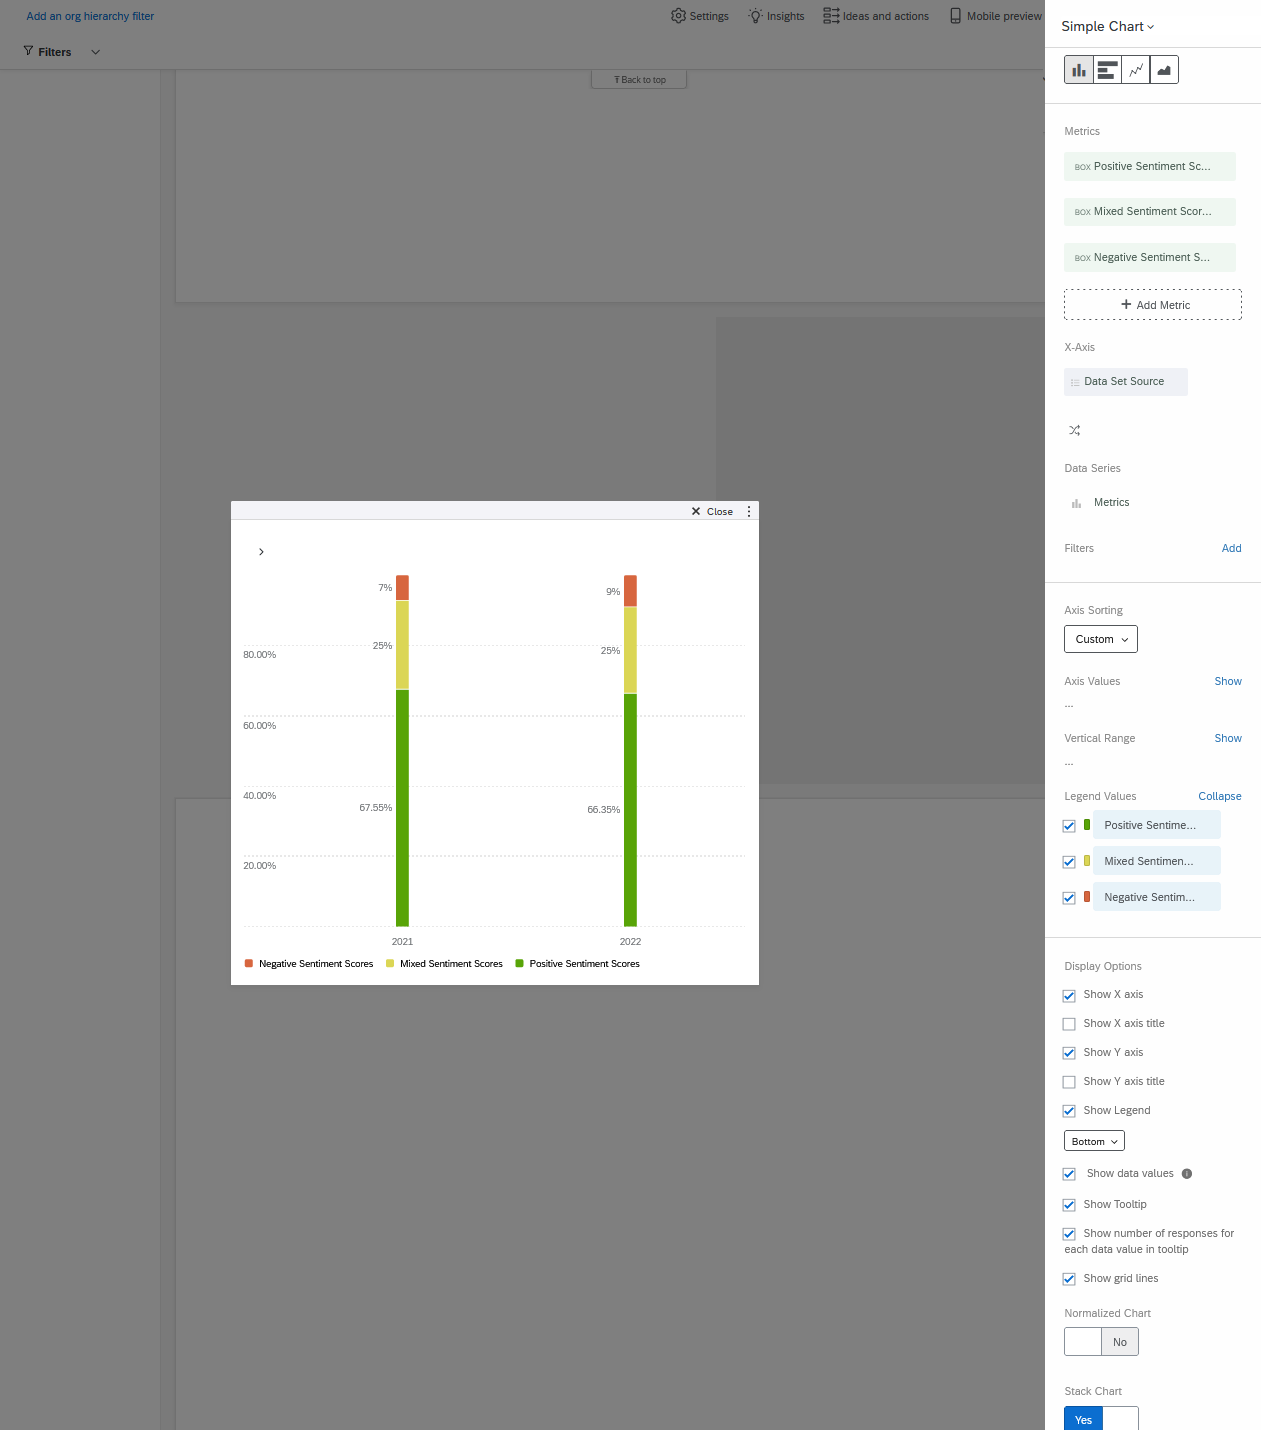
 Simple Chart widget with Top Box/Bottom Box metrics on Sentiment Score (numeric field type) - variant 1 with bars
 Simple Chart widget with Top Box/Bottom Box metrics on Sentiment Score (numeric field type) - variant 2 with lines
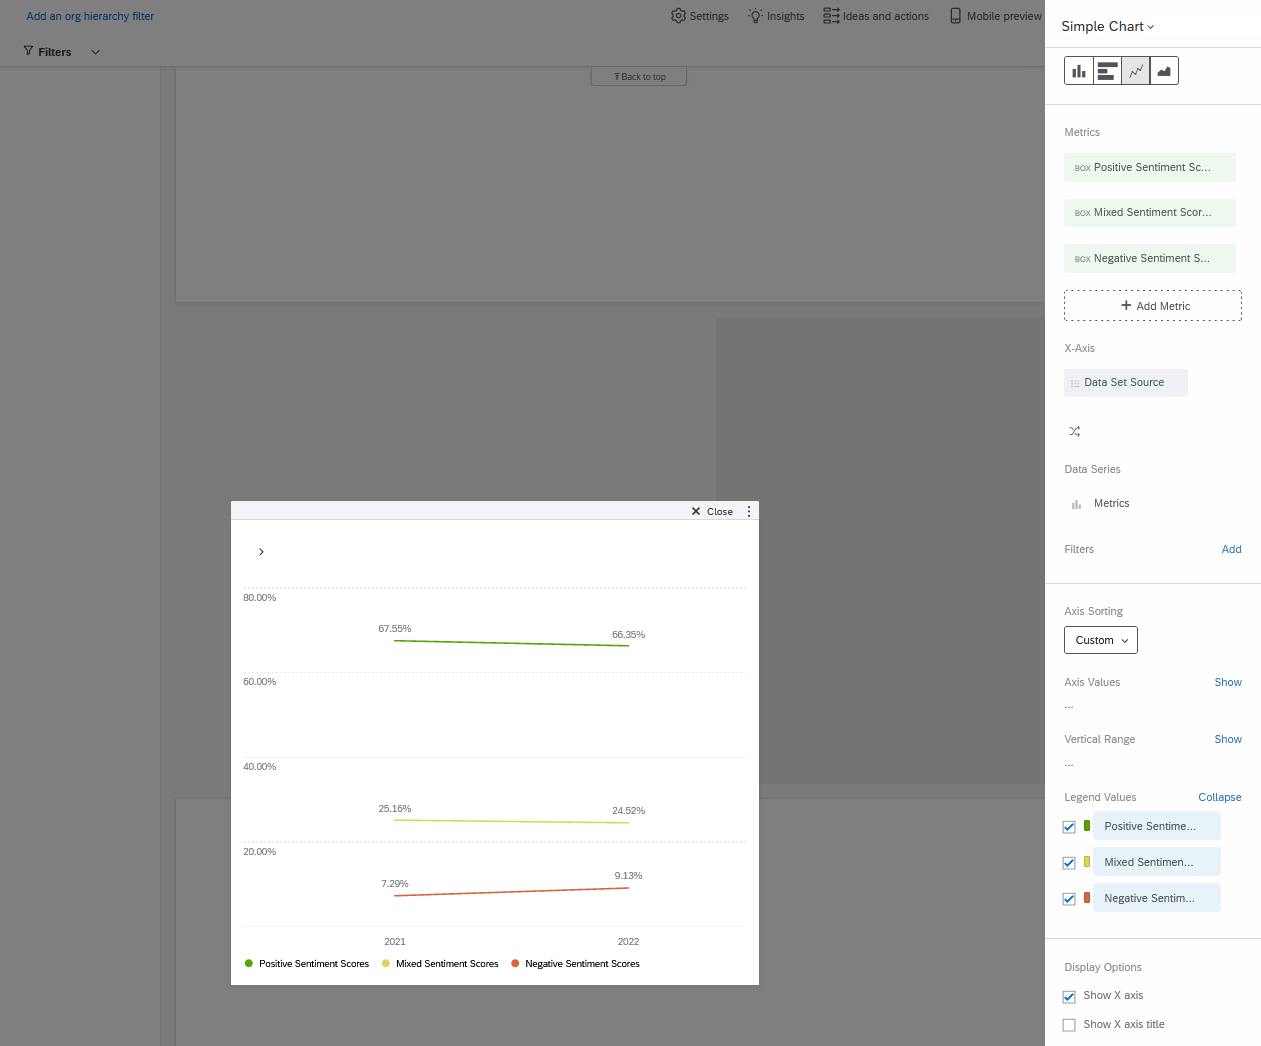
There's surely more that can be explored on this. This is simply what I've been able to turn up thus far. I'd love to see variations you may come up with. Oh, and I just saw that your post had CX tags instead of EX tags. I did this all in an EX dashboard, so I hope (and anticipate) it's all available to you in a CX dashboard.
Leave a Reply
Enter your E-mail address. We'll send you an e-mail with instructions to reset your password.
