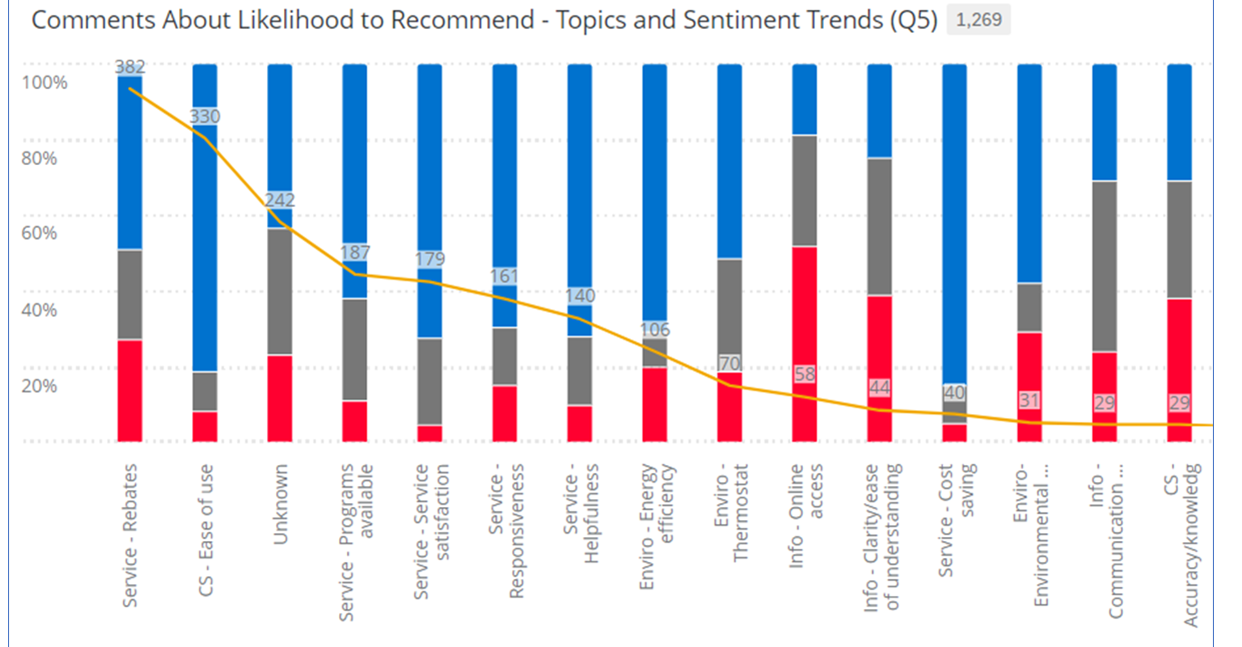
Since Qualtrics took away the Topic Sentiment Polarity variable and replaced it with inconveniently-named value labels, has anyone come up with an easy way to display the distribution of sentiment around each topic in a dashboard?
Specifically, we are looking for when Text iQ is applied in the SURVEY part of the platform and then mapped to the dashboard manually.
We used to be able to easily view the percent of comments about each topic that were negative, neutral, or positive, like this: Thanks in advance!
-Pam
Be the first to reply!
Leave a Reply
Enter your E-mail address. We'll send you an e-mail with instructions to reset your password.
