Can i have a widget that shows the number of KPi that improve compare with historical data? | XM Community
Skip to main content

Hi 

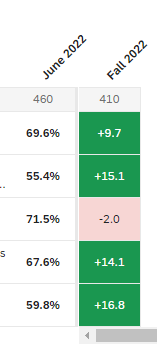
I i am working on a EX engagement survey and i need a widget that show the number of responses that improve compare to the last survey and those that did worse. so for example if i have 26 KPI, and we improve in 3 KPIs and 4 KPS decrease to show this two numbers. the 3 and the 4.


Ignore those other KPIs that did not get any variation regarding the historical data.


Any idea of how can i make this work?

@Erikahuer I think the Heat Map widget would do what you’re looking for. 


The thing is that the heat map will show the questions and it's differences. 
We Would need to have just the number of the questions that suffered a positive variation and the number that suffered a negative one.

Something like this:


Leave a Reply