I am a big fan of Stat iQ, but have run into some issues when relating a variable with check-all-that-apply (e.g., types of discrimination) and a category (e.g., gender). The kicker is that the responses to the types of discrimination is based on display logic of those who responded "yes" to the previous question asking whether or not they have experienced discrimination in the workplace. So, not everyone who responded to the gender question is responding to the types of discrimination question.
When I export the results after relating them in Stats iQ, I get a lot of wonderful graphs, some of which are based on a sample size for all who responded to gender and another sample size based on all the boxes checked for each response option. But there doesn't appear to be an option to relate to the response count of the types of discrimination question for each gender category. I ran the numbers manually (using filters in the results section) and came up with very different results, which is disconcerting. See attached screenshot of the checked counts and sample sizes. The highlighted column is the one I compiled manually and then used to create my own graphs. 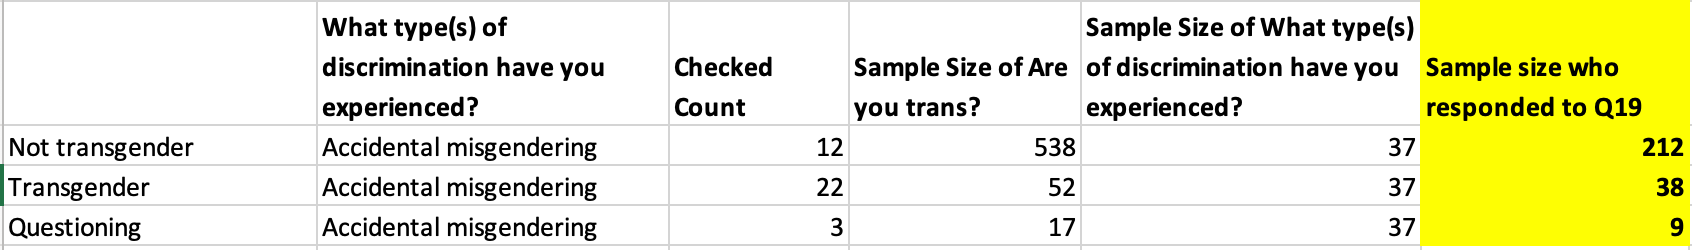 I'm wondering if this is limitation with Stat iQ, or is this due to me not understanding how to set up this type of analyse. I am hoping there is a way to set this up for Stat iQ to run rather than me having to run these manually. Any insights would be greatly appreciated!

Relating checkboxes and categories variables

Sign up
Already have an account? Login

Welcome! To join the Qualtrics Experience Community, log in with your existing Qualtrics credentials below.
Confirm your username, share a bit about yourself, Once your account has been approved by our admins then you're ready to explore and connect .
Free trial account? No problem. Log in with your trial credentials to join.
No free trial account? No problem! Register here
Already a member? Hi and welcome back! We're glad you're here 🙂
You will see the Qualtrics login page briefly before being taken to the Experience Community
Login with Qualtrics
Welcome! To join the Qualtrics Experience Community, log in with your existing Qualtrics credentials below.
Confirm your username, share a bit about yourself, Once your account has been approved by our admins then you're ready to explore and connect .
Free trial account? No problem. Log in with your trial credentials to join. No free trial account? No problem! Register here
Already a member? Hi and welcome back! We're glad you're here 🙂
You will see the Qualtrics login page briefly before being taken to the Experience Community
Login to the Community
Welcome! To join the Qualtrics Experience Community, log in with your existing Qualtrics credentials below.
Confirm your username, share a bit about yourself, Once your account has been approved by our admins then you're ready to explore and connect .
Free trial account? No problem. Log in with your trial credentials to join.
No free trial account? No problem! Register here
Already a member? Hi and welcome back! We're glad you're here 🙂
You will see the Qualtrics login page briefly before being taken to the Experience Community
Login with Qualtrics
Welcome! To join the Qualtrics Experience Community, log in with your existing Qualtrics credentials below.
Confirm your username, share a bit about yourself, Once your account has been approved by our admins then you're ready to explore and connect .
Free trial account? No problem. Log in with your trial credentials to join. No free trial account? No problem! Register here
Already a member? Hi and welcome back! We're glad you're here 🙂
You will see the Qualtrics login page briefly before being taken to the Experience Community
Enter your E-mail address. We'll send you an e-mail with instructions to reset your password.