Hi,
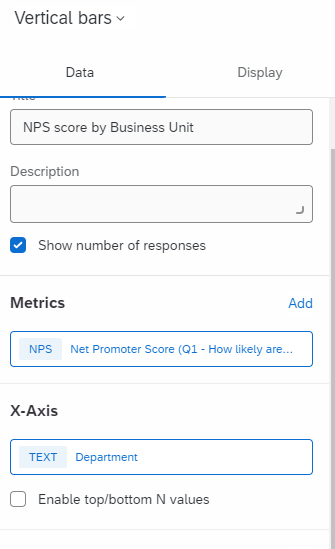
I need some help in in showing the NPS score for each dept in a bar chart in my report. I am able to calculate the overall in a guage chart but couldn’t group it for different categories.
I need to show the data in the following format in my report:


