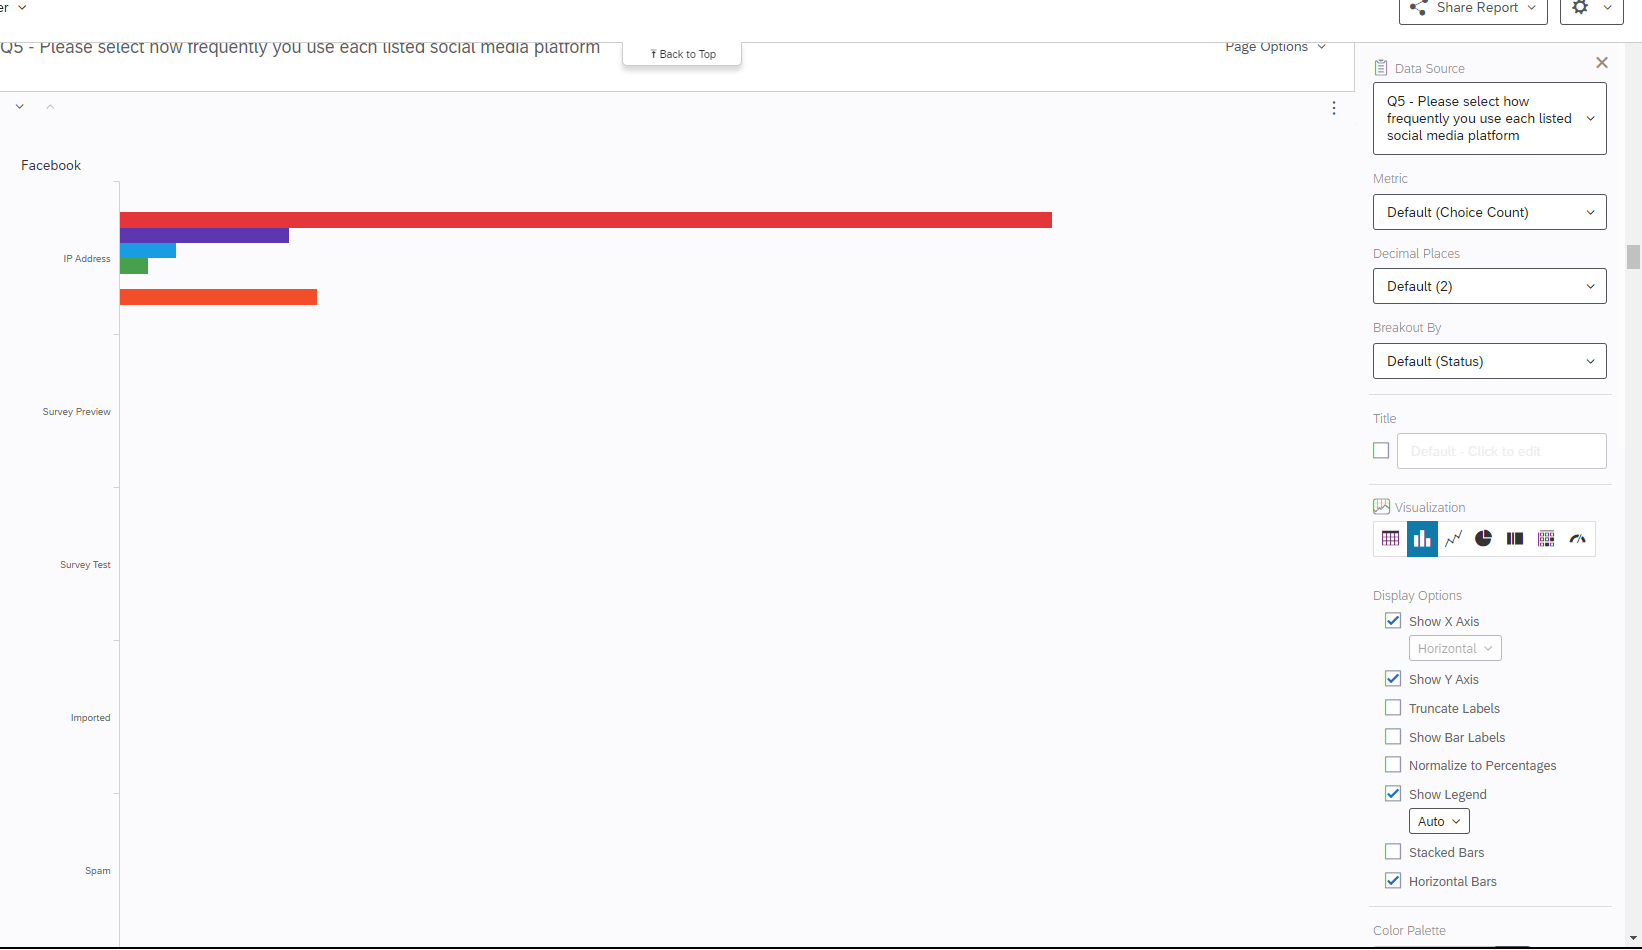
Standard survey with questions regarding social media use. We are trying to determine how many hours per day a participant spends on different social media platforms. Rather than grouping the results into a single graph with the x axis being hours spent and the y axis being social media platform, it has become 6 different graphs for each social media platform, with the y axis becoming the medium for which the respondent used to answer the survey (see picture). We can't figure out what is going one, any solutions?


