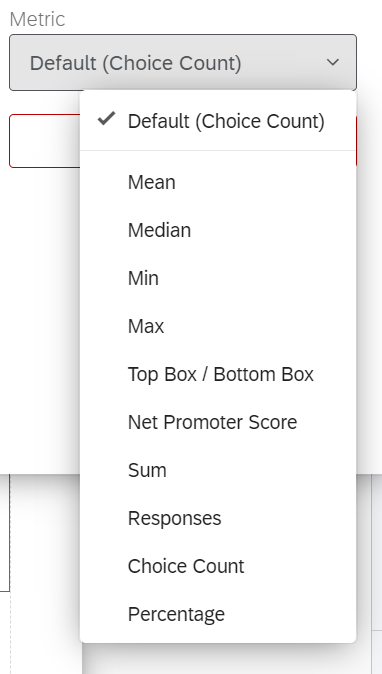
I am new to Qualtrics and I am in the process of creating a survey to be used by raters to score a number of interview candidates. I have created the survey and have used display logic to only show certain feedback options (depending on the score the raters give the candidate). I want to be able to show this feedback as text when I generate the reports (which will go to candidates). In my case the raters will not need a report, I only need to generate ‘feedback reports’ for each individual candidate. The final report should have the candidates name (which is part of a dropdown list at the beginning of the survey which raters pick), the different dimensions they were scored in, and the corresponding feedback they received on each dimension.
Any tips, courses to take or advice is welcome!
Page 1 / 1
I would recommend creating a report in the results or report tab. You would be able to create a separate one for each candidate and you would be able to export it as a PDF to send the candidate or you can generate a public link to the report. You can also add in extra text boxes as needed and any question responses to display in different types of visualizations.
@XM_CarlosF Your report should pose no problem, a simple gauge or barchart should show you the score, record table for the feedback detail. Remember to put filter on them for each candidate. Then copy and change filter.
Thank you for the responses @ash123@dxconnamnguyen .
I don’t need a total count or bar charts for this. And I have implemented your advice and I am filtering by name. I am trying to make the report look something like this:
Candidate name (In first block; dropdown candidate list)
Department Name
Dimension 1: Feedback text only ( Ex. Your did well in section abc but we thought you could improve on xyz)
Dimension 2: Feedback text only
Dimension 3: Feedback text only
And so forth, for each candidate rated by the same raters/judges.
@XM_CarlosF Then a data table is suitable for you
@dxconnamnguyen That gets me a little closer, but it is showing the choice count for each score
You can click on the table, and select the metric. Then, under “source” for that metric, if you click into “metric,” there’s options to choose different types of fields like percentage, count, etc.
@dxconnamnguyen I don’t want any of those to show Since the majority of responses were the 6-7 category I only need the feedback for 6-7 to show in the report. No percentage, median, mean, etc.
Sorry for taking your time on such basic things but I am trying to figure it out as I go.
I’m having a hard time thinking of a way for it to automatically just show the most answered choice for the question without any metrics or counts by it. As a workaround, you can maybe insert a text box and manually type that the score is “6-7.” That may be inefficient though depending on how many candidates you have.