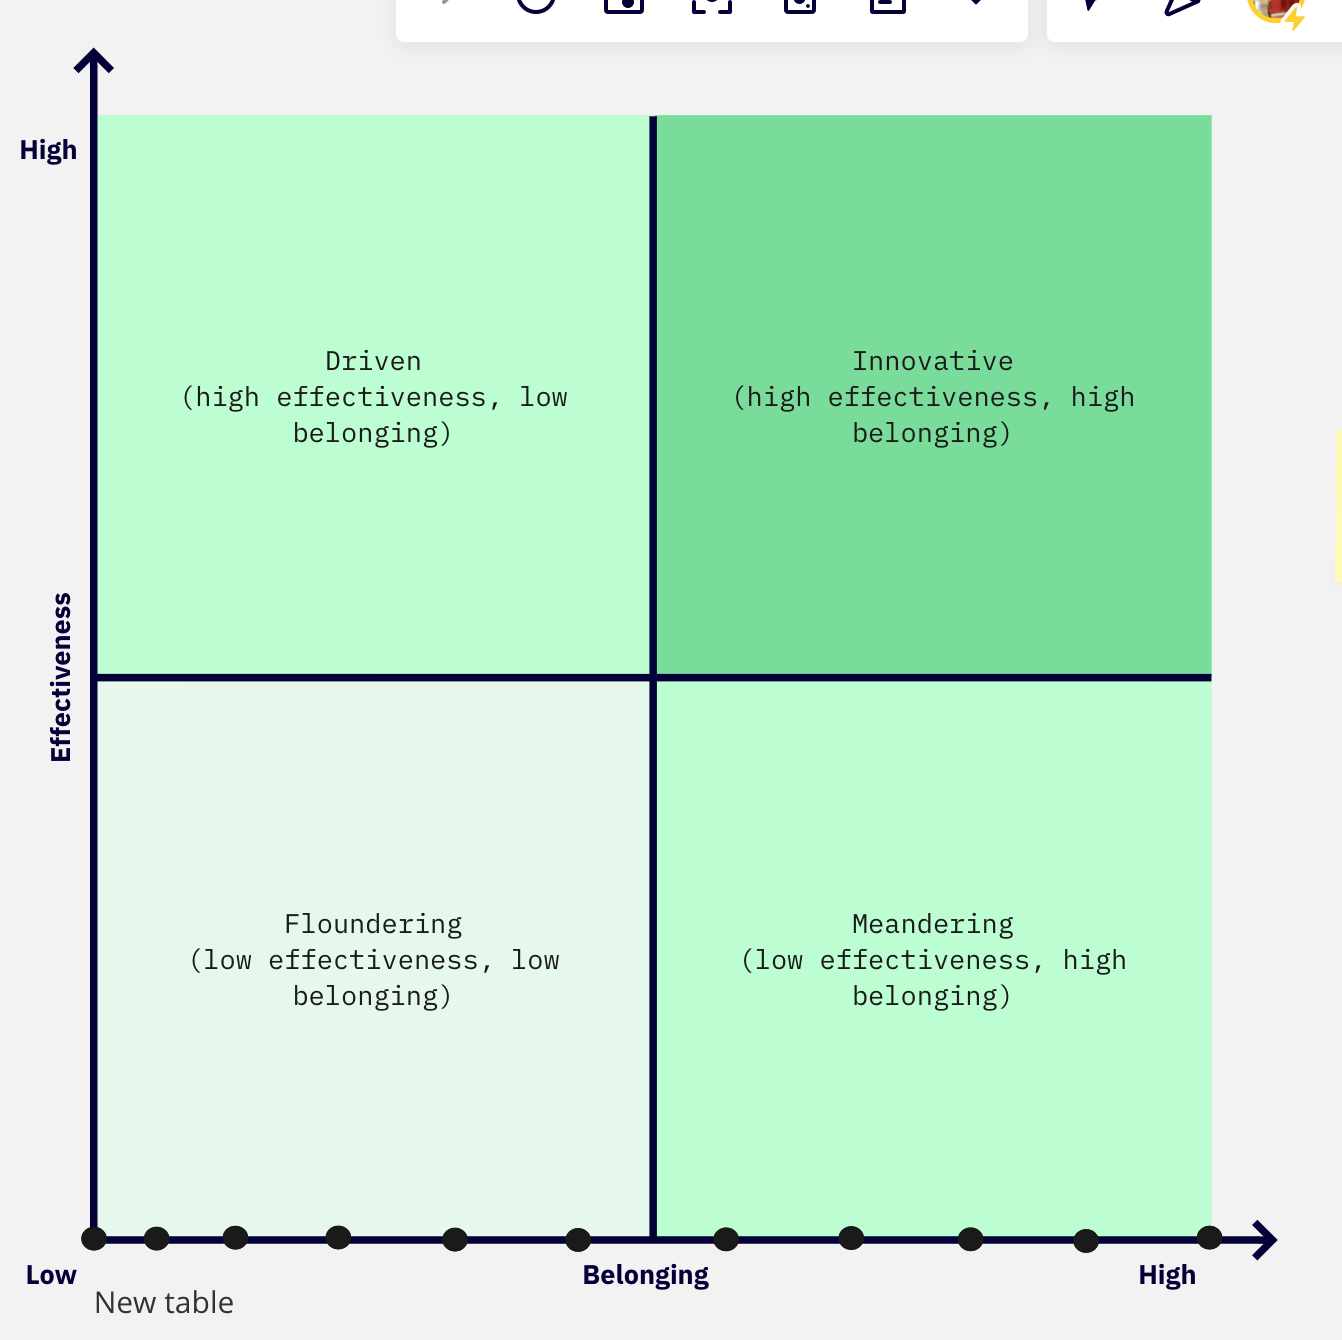
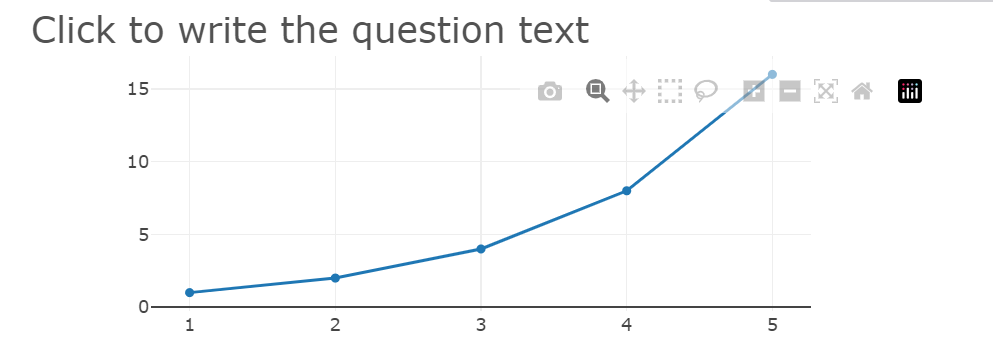
We are creating a teamwork assessment task in Qualtrics. Individual respondents rate their team on a number of items that are tagged as either contributing to qualityA or qualityB of the group work. We have set up scoring so that respondents receive a score of 0 to 50 on each of these dimensions. We have created a summary page using the Text/Graphic question type on which the respondents receive their scores. We also want to include on this page a graph like the one below, showing where they rated on the scale.
I am looking for recommendations and ideas to make this work. I have been looking at us Javascript. Unfortunately, you cannot call on script libraries from within the HTML editor. I have been looking at the Javascript option in Qualtrics, but I am unsure of how to call on libraries, such as Plotly.js from within the script editor. Any ideas or recommendation are much appreciated.


