Hi all - I'm trying to create a test which will display a score at the end of the survey to the respondents based on the Brief Resilience Scale. I've created the survey and scored the responses, however the final score needs to be divided by the number of questions before it is displayed to the respondent to give the BRS Score (e.g. final score/6). (The BRS Score is calculated by Adding the responses varying from 1-5 for all six items giving a range from 6-30. Divide the total sum by the total number of questions answered.)
I've had a play with Math Operators (should say I'm a bit of a Qualtrics Novice) and I can see how they can be applied to a question, but not to a score?

Solved
Display an average of the final score to the respondent
Best answer by Tom_1842
Hi,
You could get Math Operations involved here, but I think you could display this information just using piped text.
If your Scoring is set up to be just for the BRS question, then you can display the Score's mean to the respondent by going to the rich text editor, then clicking the piped text icon {A}, then Scoring, then the BRS Score category, and then the Weighted Mean.
If you wanted to go the Math Operations route, you would go to the Survey Flow and pipe in the Scoring information the same way as above when setting up the embedded field to capture that value, like in the below: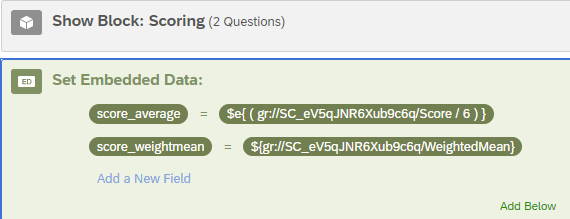


Sign up
Already have an account? Login

Welcome! To join the Qualtrics Experience Community, log in with your existing Qualtrics credentials below.
Confirm your username, share a bit about yourself, then you're ready to explore and connect .
Free trial account? No problem. Log in with your trial credentials to join.
No free trial account? No problem! Register here
Already a member? Hi and welcome back! We're glad you're here 🙂
You will see the Qualtrics login page briefly before being taken to the Experience Community.
Login with Qualtrics
Welcome! To join the Qualtrics Experience Community, log in with your existing Qualtrics credentials below.
Confirm your username, share a bit about yourself, then you're ready to explore and connect .
Free trial account? No problem. Log in with your trial credentials to join. No free trial account? No problem! Register here
Already a member? Hi and welcome back! We're glad you're here 🙂
You will see the Qualtrics login page briefly before being taken to the Experience Community.
Login to the Community
No account yet? Create an account
Welcome! To join the Qualtrics Experience Community, log in with your existing Qualtrics credentials below.
Confirm your username, share a bit about yourself, then you're ready to explore and connect .
Free trial account? No problem. Log in with your trial credentials to join.
No free trial account? No problem! Register here
Already a member? Hi and welcome back! We're glad you're here 🙂
You will see the Qualtrics login page briefly before being taken to the Experience Community.
Login with Qualtrics
Welcome! To join the Qualtrics Experience Community, log in with your existing Qualtrics credentials below.
Confirm your username, share a bit about yourself, then you're ready to explore and connect .
Free trial account? No problem. Log in with your trial credentials to join. No free trial account? No problem! Register here
Already a member? Hi and welcome back! We're glad you're here 🙂
You will see the Qualtrics login page briefly before being taken to the Experience Community.
Enter your E-mail address. We'll send you an e-mail with instructions to reset your password.