Hi,
I have distributed a survey using a handful of links. Each link was created so we can later determine the source of the response (post A, blog B, newsletter C, etc.). None of the links were sent via Qualtrics. Note that I created each link type by manually appending different suffixes based on the source where the survey link would be posted.
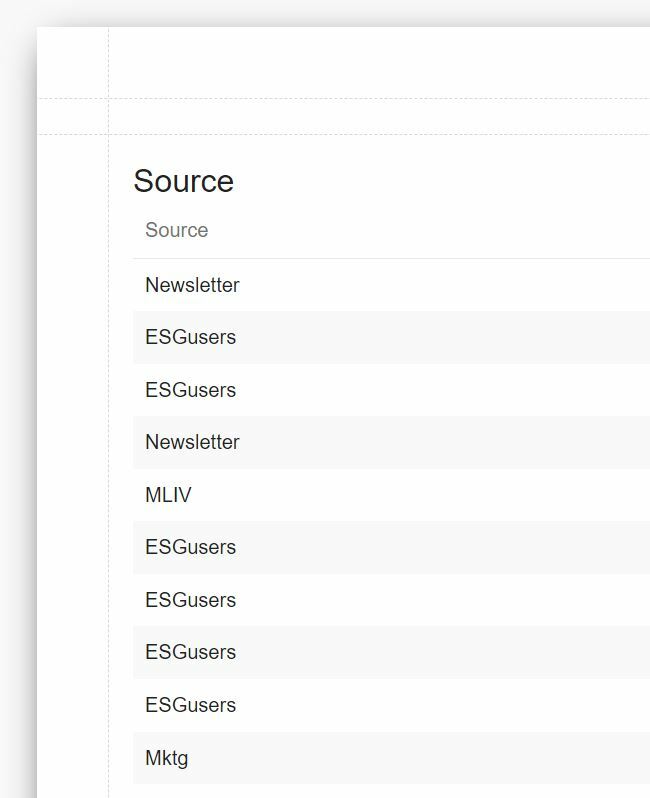
Now, I'd like to know how I can view distribution summary by link/source. When I look at the distribution currently, it shows all sources as "anonymous link." Is there a way to easily show completes, dropouts, etc. by link/source? The only way I am able to do this now is by exporting the data and manually sorting it.
ALSO - is it possible to have partial responses included in the distribution, rather than just completes?
Thank you.

Distribution report by link (with partials)
 +1
+1

Sign up
Already have an account? Login

Welcome! To join the Qualtrics Experience Community, log in with your existing Qualtrics credentials below.
Confirm your username, share a bit about yourself, then you're ready to explore and connect .
Free trial account? No problem. Log in with your trial credentials to join.
No free trial account? No problem! Register here
Already a member? Hi and welcome back! We're glad you're here 🙂
You will see the Qualtrics login page briefly before being taken to the Experience Community.
Login with Qualtrics
Welcome! To join the Qualtrics Experience Community, log in with your existing Qualtrics credentials below.
Confirm your username, share a bit about yourself, then you're ready to explore and connect .
Free trial account? No problem. Log in with your trial credentials to join. No free trial account? No problem! Register here
Already a member? Hi and welcome back! We're glad you're here 🙂
You will see the Qualtrics login page briefly before being taken to the Experience Community.
Login to the Community
Welcome! To join the Qualtrics Experience Community, log in with your existing Qualtrics credentials below.
Confirm your username, share a bit about yourself, then you're ready to explore and connect .
Free trial account? No problem. Log in with your trial credentials to join.
No free trial account? No problem! Register here
Already a member? Hi and welcome back! We're glad you're here 🙂
You will see the Qualtrics login page briefly before being taken to the Experience Community.
Login with Qualtrics
Welcome! To join the Qualtrics Experience Community, log in with your existing Qualtrics credentials below.
Confirm your username, share a bit about yourself, then you're ready to explore and connect .
Free trial account? No problem. Log in with your trial credentials to join. No free trial account? No problem! Register here
Already a member? Hi and welcome back! We're glad you're here 🙂
You will see the Qualtrics login page briefly before being taken to the Experience Community.
Enter your E-mail address. We'll send you an e-mail with instructions to reset your password.