Hello Everyone,
I would like to create a simple bar chart in Qualtrics using Javascript. My main question is what kinds of features need to be enabled in my account such that this figure becomes visible?
The code I am using (see below) works when inserted into a survey that was built by someone at an institution with a broader license, but not with mine, and I would like to know what kinds of features need to be enabled. I am also attaching a photo of what this chart looks like when previewed in the account with the broader license (the preview tab remains blank, however, in my version of Qualtrics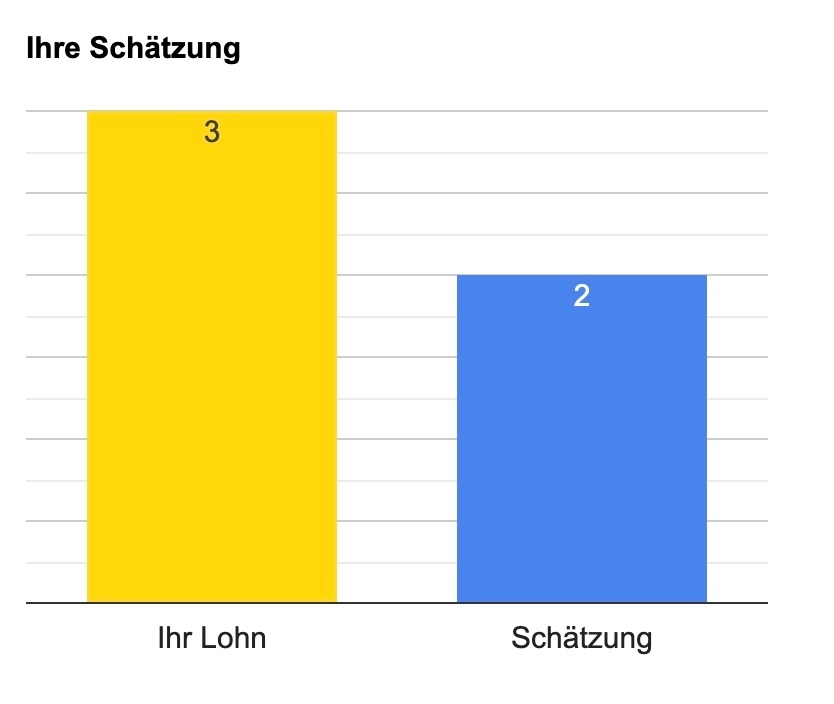 ).
).
Thanks a lot!
Best,
Chantal
--
This is the code:
Qualtrics.SurveyEngine.addOnload(function(){
google.charts.load("current", {
packages: ['corechart'], 'language': 'pt'
});
google.charts.setOnLoadCallback(drawChart);
function drawChart() {
var data = google.visualization.arrayToDataTable([
["Estimate", "Euro", { role: "style"}],
["Ihr Lohn",3,"gold"],
["Schätzung", 2, "color: #4885ed"],
]);
var view = new google.visualization.DataView(data);
view.setColumns([0, 1,
{calc: "stringify",
sourceColumn: 1,
type: "string",
role: "annotation"
},
2]);
var options = {
title: "Ihre Schätzung",
width: 600,
height: 400,
vAxis: {
viewWindow: {
min: 0},
format: '#.#' },
fontSize: 15,
bar: {
groupWidth: "67.5%"
},
legend: {
position: "none"
},
};
var chart = new google.visualization.ColumnChart(document.getElementById("columnchart_values"));
chart.draw(view, options);
}
});

Javascript to Create Bar Charts
 +5
+5

Sign up
Already have an account? Login

Welcome! To join the Qualtrics Experience Community, log in with your existing Qualtrics credentials below.
Confirm your username, share a bit about yourself, then you're ready to explore and connect .
Free trial account? No problem. Log in with your trial credentials to join.
No free trial account? No problem! Register here
Already a member? Hi and welcome back! We're glad you're here 🙂
You will see the Qualtrics login page briefly before being taken to the Experience Community.
Login with Qualtrics
Welcome! To join the Qualtrics Experience Community, log in with your existing Qualtrics credentials below.
Confirm your username, share a bit about yourself, then you're ready to explore and connect .
Free trial account? No problem. Log in with your trial credentials to join. No free trial account? No problem! Register here
Already a member? Hi and welcome back! We're glad you're here 🙂
You will see the Qualtrics login page briefly before being taken to the Experience Community.
Login to the Community
Welcome! To join the Qualtrics Experience Community, log in with your existing Qualtrics credentials below.
Confirm your username, share a bit about yourself, then you're ready to explore and connect .
Free trial account? No problem. Log in with your trial credentials to join.
No free trial account? No problem! Register here
Already a member? Hi and welcome back! We're glad you're here 🙂
You will see the Qualtrics login page briefly before being taken to the Experience Community.
Login with Qualtrics
Welcome! To join the Qualtrics Experience Community, log in with your existing Qualtrics credentials below.
Confirm your username, share a bit about yourself, then you're ready to explore and connect .
Free trial account? No problem. Log in with your trial credentials to join. No free trial account? No problem! Register here
Already a member? Hi and welcome back! We're glad you're here 🙂
You will see the Qualtrics login page briefly before being taken to the Experience Community.
Enter your E-mail address. We'll send you an e-mail with instructions to reset your password.