Hi all
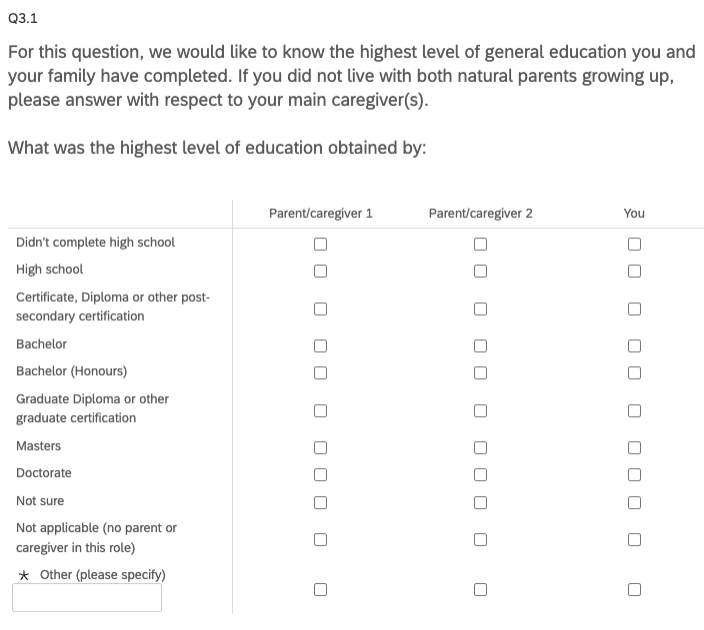
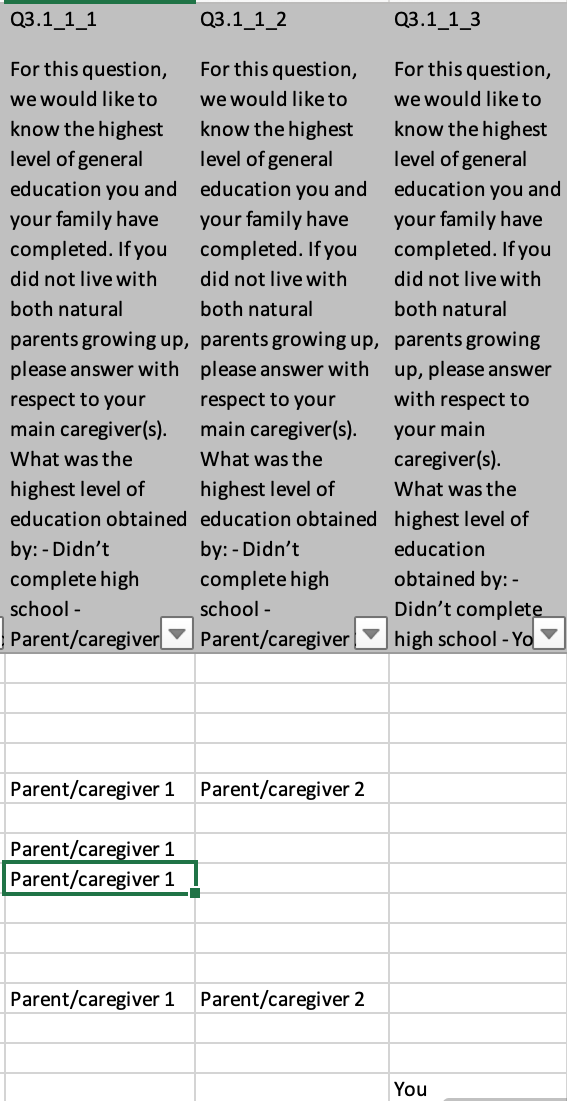
I have collected a number of responses for my survey in Matrix table questions. I asked individuals about their level of education obtained for them and their parents, with the levels of education in the rows and people (parents and participant) in columns of the table. When I export the data, data columns are displayed in terms of the rows (levels of education) rather than people (which you can see in the Excel screenshot). Is there any way to change the way the way this data displays? Thanks!

Matrix table data
Best answer by bgooldfed
Hi qualtricstg,
There is some documentation which describes the two ways you can export data belonging to a multiple choice matrix like yours. Scroll down to "MULTI-ANSWER LIKERT MATRIX TABLE" to find it.
The second option described in the linked documentation should give you column headers structured like {Question} - {"Parent/Caregiver x" / "You"} - {Education level}, and each row will denote the respective selection. I'm not sure if that exactly meets your needs, but it's the closest you'll get without having to do further manipulation.
Good luck!
Sign up
Already have an account? Login

Welcome! To join the Qualtrics Experience Community, log in with your existing Qualtrics credentials below.
Confirm your username, share a bit about yourself, Once your account has been approved by our admins then you're ready to explore and connect .
Free trial account? No problem. Log in with your trial credentials to join.
No free trial account? No problem! Register here
Already a member? Hi and welcome back! We're glad you're here 🙂
You will see the Qualtrics login page briefly before being taken to the Experience Community
Login with Qualtrics

Welcome! To join the Qualtrics Experience Community, log in with your existing Qualtrics credentials below.
Confirm your username, share a bit about yourself, Once your account has been approved by our admins then you're ready to explore and connect .
Free trial account? No problem. Log in with your trial credentials to join. No free trial account? No problem! Register here
Already a member? Hi and welcome back! We're glad you're here 🙂
You will see the Qualtrics login page briefly before being taken to the Experience Community
Login to the Community

Welcome! To join the Qualtrics Experience Community, log in with your existing Qualtrics credentials below.
Confirm your username, share a bit about yourself, Once your account has been approved by our admins then you're ready to explore and connect .
Free trial account? No problem. Log in with your trial credentials to join.
No free trial account? No problem! Register here
Already a member? Hi and welcome back! We're glad you're here 🙂
You will see the Qualtrics login page briefly before being taken to the Experience Community
Login with Qualtrics

Welcome! To join the Qualtrics Experience Community, log in with your existing Qualtrics credentials below.
Confirm your username, share a bit about yourself, Once your account has been approved by our admins then you're ready to explore and connect .
Free trial account? No problem. Log in with your trial credentials to join. No free trial account? No problem! Register here
Already a member? Hi and welcome back! We're glad you're here 🙂
You will see the Qualtrics login page briefly before being taken to the Experience Community
Enter your E-mail address. We'll send you an e-mail with instructions to reset your password.


