

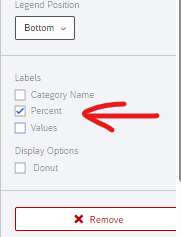
Hi, I have a question on the pie charts created in Qualtrics Reports. The data appear to show as counts in the “slices” of the pie chart, but I am looking for a way to display percentages (of the total responses) instead of count values. Is there a way to change this in the pie chart?


Enter your E-mail address. We'll send you an e-mail with instructions to reset your password.