Using the new Results: can't select question when trying to visualize average | XM Community
Skip to main content

I am trying to create a gauge visualization in the new Results dashboard. The question I need it for has 5 responses, coded 1-5:
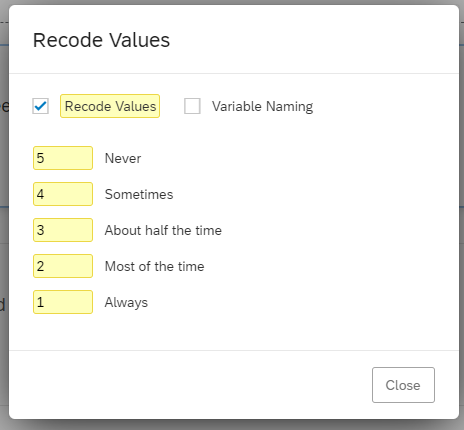


In the new Results dashboard, I selected “New Widget” and “Gauge Chart”. When I go to the Field dropdown menu in the Metrics configuration for the Widget, it only provides a limited number of questions from which I can calculate an average. I assume that has to do with data type, however, I should be able to calculate an average for this question. Is there a setting I need to change in the question or in Results? Thanks.
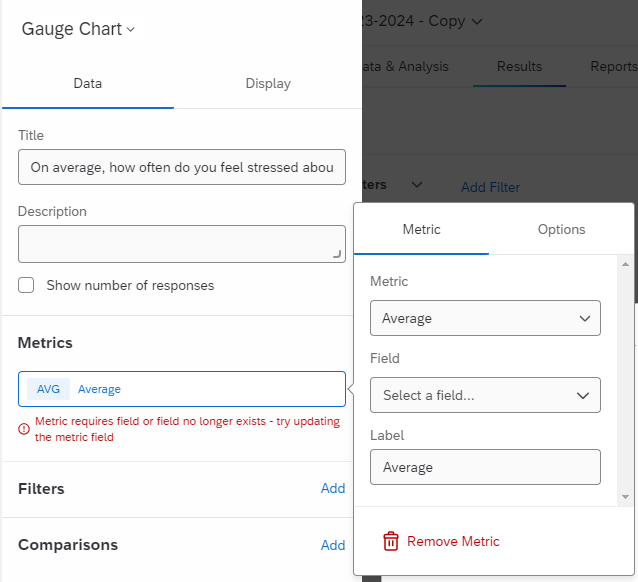
*EDIT* It actually won’t let me visualize any of the available questions in the Field dropdown menu. It says my “filters may be too exclusive” but I don’t have any filters selected in the widget or on the dashboard.

Wow, I forgot I asked this question. No one has any answers for me?


Make the field as number set. Please check this.


Starting with Shashi’s suggestion, I found this: https://www.qualtrics.com/support/vocalize/dashboard-settings-cx/dashboard-data/data-compatibility/ . I can’t figure out how to change the data type for the survey question. In the data table under “Data & Analysis”, it gives me the option to view the answers as numeric values (the recode values). I’m not sure why I can’t use those recode values to create the gauge chart.


Apparently in a Survey Project Results Dashboard you are unable to change the data type/field type: https://www.qualtrics.com/support/survey-platform/reports-module/results-dashboards/results-dashboards-widgets/#QuestionFieldTypes

This didn’t use to be the case, as I had built tables that used averages of recode values per question that no longer work. I get the same error message as you. Frustratingly these calculations work fine in Reports visualizations, so I don’t know why it is different in the supposedly new and improved interface.


I have discovered a workaround for this issue, which is to use the Field Editor on the Data & Analysis tab to create a corresponding Formula Variable for each question: https://www.qualtrics.com/support/survey-platform/data-and-analysis-module/data/add-new-fields/formula-variable-creation/

This new field will have a numeric value set by your recode value, which you can then use in metric fields in your dashboard. I’ve attached a screenshot of how I set up one of these. It is a huge pain to have to do this for every question, but I can at least confirm that it works.


Leave a Reply