Hello,
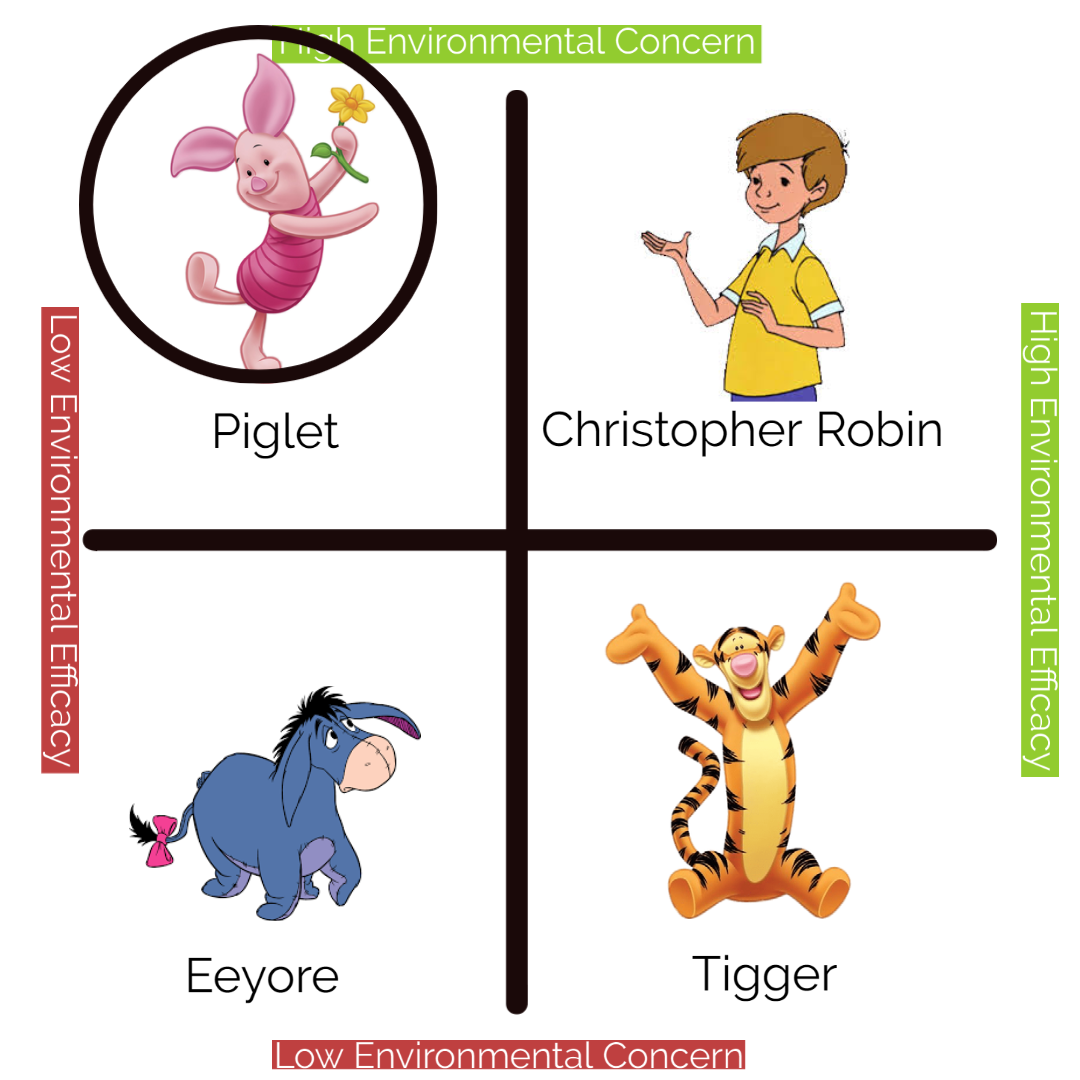
Qualtrics Newbie here, I am trying to do a kind of "reportback" for respondents completing a survey about environmental attitudes. Essentially, the survey has two metrics, environmental concern and connection to the environment. Based on a respondent's answers to these metrics they get sorted into one of four quadrants on a two-axis graph (high environmental concern and high environmental efficacy, high EC and low EE, low EC and low EE, etc.). It is supposed to be kind of like a personality test.
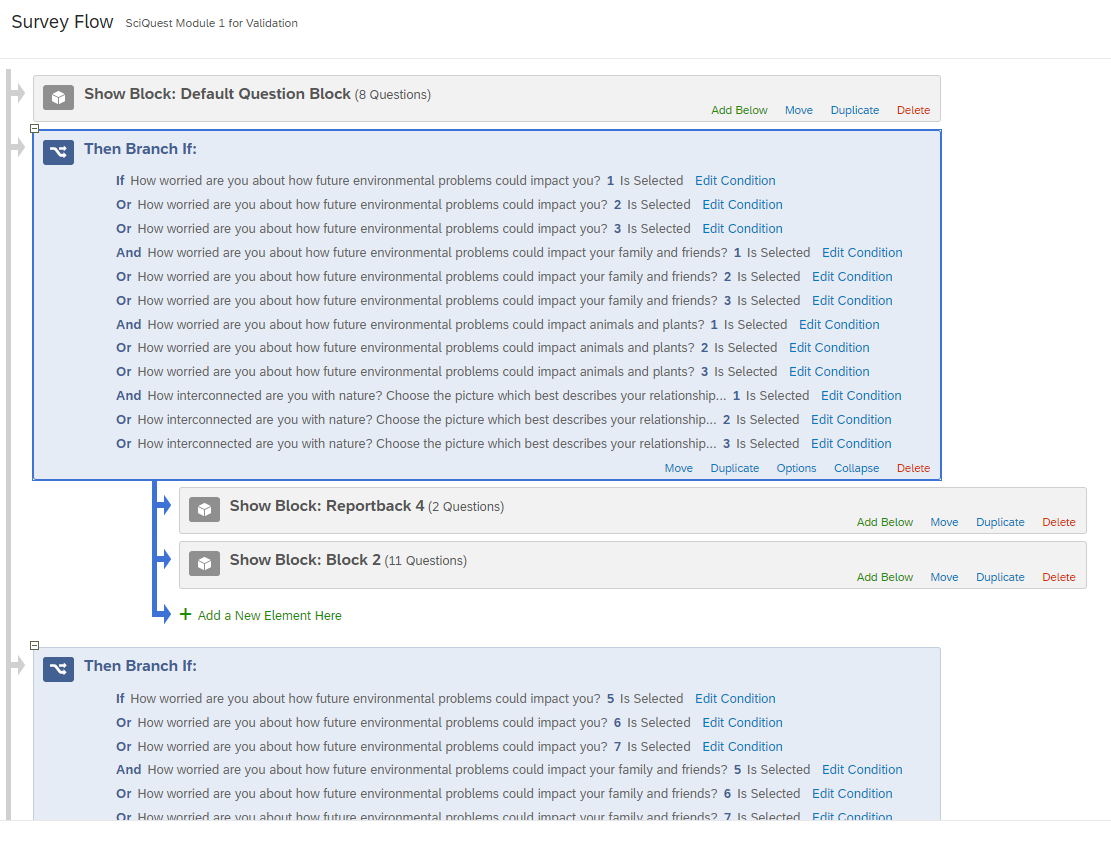
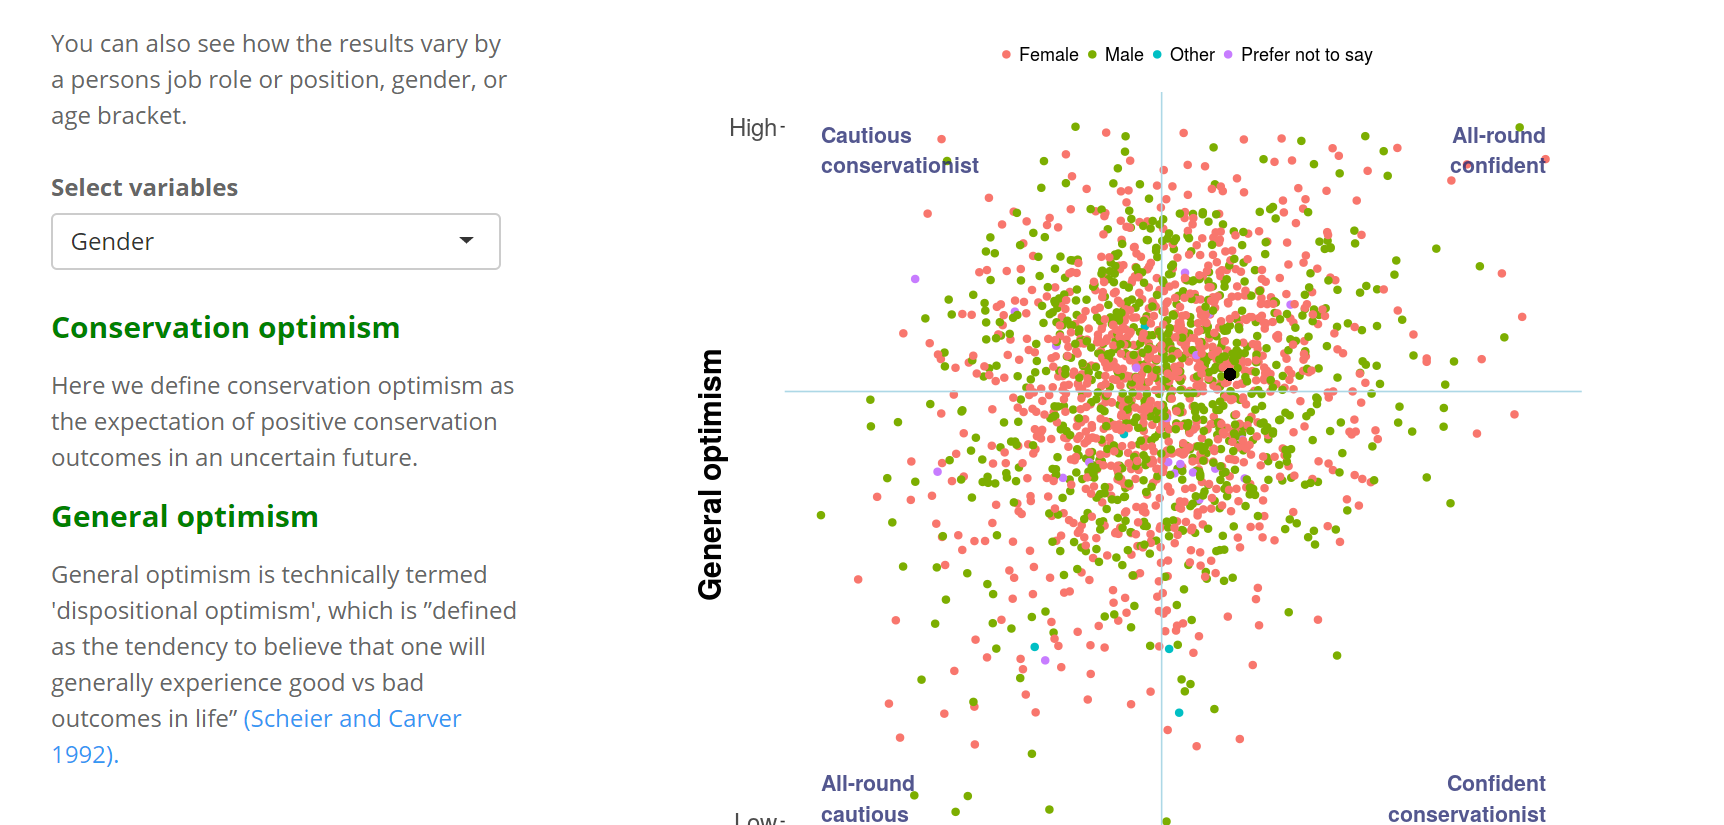
So far, I have been able to do this based on survey flow branching. For instance, if their responses indicate high EC and low EE they get branched to a survey block that shows a static image with the appropriate quadrant circled. However, this feels like a sort of hackish way to do this and isn't exactly what I want. Ideally, I would want someone to see where on the two-axis graph they are, and where other people fall that have taken the same survey (allowing each respondent to see whether they are "normal" or not). Does anyone have any ideas for how to do a reportback like this? I have attached some photos that show what I am explaining more clearly. The "Winnie the Pooh" graph contains the four quadrants that are available. I want someone to take this survey and see a single point on the graph that represents them, and a cloud of other points (perhaps a different color?) that are the other respondents to the survey. I have seen this kind of thing before.
 For instance, this survey (photo below; you can also find it online here: https://livedataoxford.shinyapps.io/lifeinconservation/ ) does essentially what I was hoping to do.
  Any thoughts on how to do a reportback like this with Qualtrics? Any thoughts are appreciated. I know you can do Qualtrics "Reports" at the end of a survey but I haven't seen any capacity for doing something like this with the different quadrants.
Thanks for any insight this community can provide,
Bradley
Allowing survey respondents to compare their score to others
Sign up
Already have an account? Login

Welcome! To join the Qualtrics Experience Community, log in with your existing Qualtrics credentials below.
Confirm your username, share a bit about yourself, Once your account has been approved by our admins then you're ready to explore and connect .
Free trial account? No problem. Log in with your trial credentials to join.
No free trial account? No problem! Register here
Already a member? Hi and welcome back! We're glad you're here 🙂
You will see the Qualtrics login page briefly before being taken to the Experience Community
Login with Qualtrics

Welcome! To join the Qualtrics Experience Community, log in with your existing Qualtrics credentials below.
Confirm your username, share a bit about yourself, Once your account has been approved by our admins then you're ready to explore and connect .
Free trial account? No problem. Log in with your trial credentials to join. No free trial account? No problem! Register here
Already a member? Hi and welcome back! We're glad you're here 🙂
You will see the Qualtrics login page briefly before being taken to the Experience Community
Login to the Community

Welcome! To join the Qualtrics Experience Community, log in with your existing Qualtrics credentials below.
Confirm your username, share a bit about yourself, Once your account has been approved by our admins then you're ready to explore and connect .
Free trial account? No problem. Log in with your trial credentials to join.
No free trial account? No problem! Register here
Already a member? Hi and welcome back! We're glad you're here 🙂
You will see the Qualtrics login page briefly before being taken to the Experience Community
Login with Qualtrics

Welcome! To join the Qualtrics Experience Community, log in with your existing Qualtrics credentials below.
Confirm your username, share a bit about yourself, Once your account has been approved by our admins then you're ready to explore and connect .
Free trial account? No problem. Log in with your trial credentials to join. No free trial account? No problem! Register here
Already a member? Hi and welcome back! We're glad you're here 🙂
You will see the Qualtrics login page briefly before being taken to the Experience Community
Enter your E-mail address. We'll send you an e-mail with instructions to reset your password.


