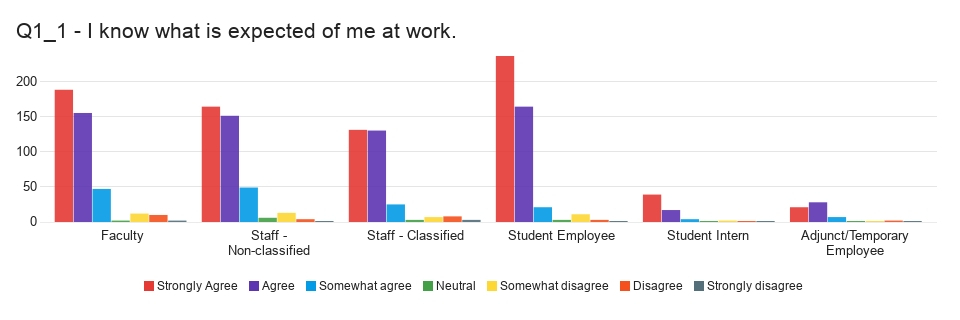
 Hi I was able to design a report in 2.0 like the image, but it has been a very manual process. Is there an easy way to breakout a matrix questions into a separate bar chart by another question, for example by employee category which is a separate question in my survey? I am also having difficulty moving the charts around on the pages of the report. The charts I am trying to move around seem to have mind of their own.
Solved
Is there an easy way to breakout a matrix questions into a separate bar chart by another question?
 +2
+2!
Hi I was able to design a report in 2.0 like the image, but it has been a very manual process. Is there an easy way to breakout a matrix questions into a separate bar chart by another question, for example by employee category which is a separate question in my survey? I am also having difficulty moving the charts around on the pages of the report. The charts I am trying to move around seem to have mind of their own.
Hi I was able to design a report in 2.0 like the image, but it has been a very manual process. Is there an easy way to breakout a matrix questions into a separate bar chart by another question, for example by employee category which is a separate question in my survey? I am also having difficulty moving the charts around on the pages of the report. The charts I am trying to move around seem to have mind of their own.Best answer by bstrahin
In advanced reports you can add filters to individual widgets. Still on the "manual" side, but allows this to be doable.
Advanced Report Filters
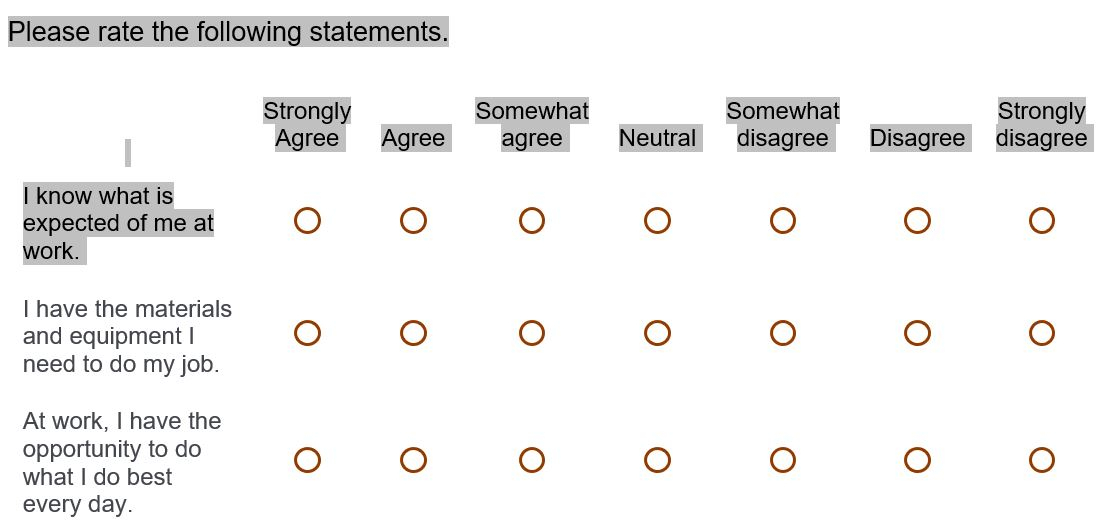 Here is an example of the type of matrix question I am trying to easily split out into separate bar charts by employee category, which is a separate question.


Sign up
Already have an account? Login

Welcome! To join the Qualtrics Experience Community, log in with your existing Qualtrics credentials below.
Confirm your username, share a bit about yourself, then you're ready to explore and connect .
Free trial account? No problem. Log in with your trial credentials to join.
No free trial account? No problem! Register here
Already a member? Hi and welcome back! We're glad you're here 🙂
You will see the Qualtrics login page briefly before being taken to the Experience Community.
Login with Qualtrics
Welcome! To join the Qualtrics Experience Community, log in with your existing Qualtrics credentials below.
Confirm your username, share a bit about yourself, then you're ready to explore and connect .
Free trial account? No problem. Log in with your trial credentials to join. No free trial account? No problem! Register here
Already a member? Hi and welcome back! We're glad you're here 🙂
You will see the Qualtrics login page briefly before being taken to the Experience Community.
Login to the Community
No account yet? Create an account
Welcome! To join the Qualtrics Experience Community, log in with your existing Qualtrics credentials below.
Confirm your username, share a bit about yourself, then you're ready to explore and connect .
Free trial account? No problem. Log in with your trial credentials to join.
No free trial account? No problem! Register here
Already a member? Hi and welcome back! We're glad you're here 🙂
You will see the Qualtrics login page briefly before being taken to the Experience Community.
Login with Qualtrics
Welcome! To join the Qualtrics Experience Community, log in with your existing Qualtrics credentials below.
Confirm your username, share a bit about yourself, then you're ready to explore and connect .
Free trial account? No problem. Log in with your trial credentials to join. No free trial account? No problem! Register here
Already a member? Hi and welcome back! We're glad you're here 🙂
You will see the Qualtrics login page briefly before being taken to the Experience Community.
Enter your E-mail address. We'll send you an e-mail with instructions to reset your password.