Is there an easy way to breakout a matrix questions into a separate bar chart by another question? | XM Community
Skip to main content
!

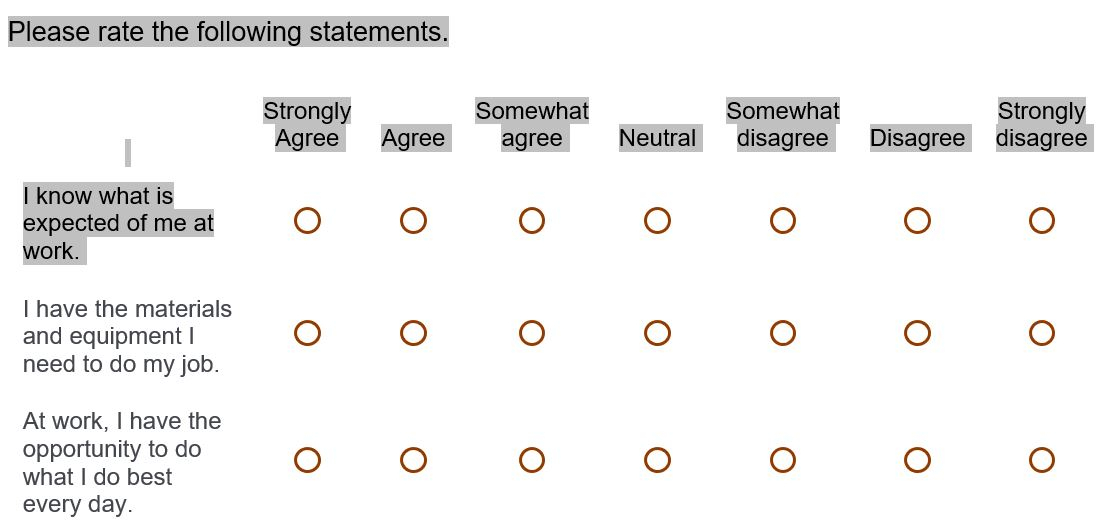
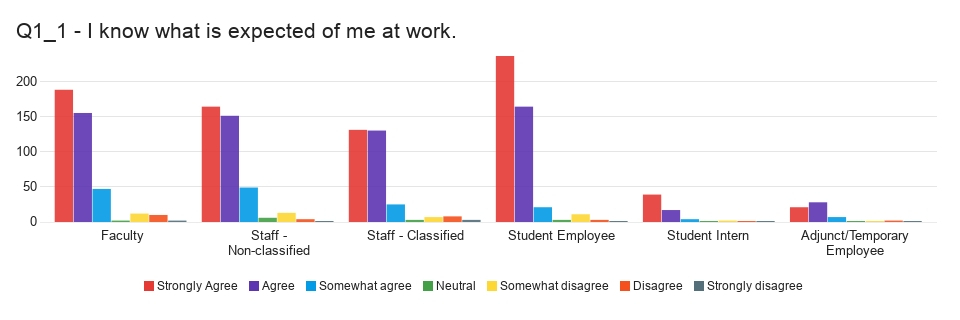
Hi I was able to design a report in 2.0 like the image, but it has been a very manual process. Is there an easy way to breakout a matrix questions into a separate bar chart by another question, for example by employee category which is a separate question in my survey? I am also having difficulty moving the charts around on the pages of the report. The charts I am trying to move around seem to have mind of their own.
!

Here is an example of the type of matrix question I am trying to easily split out into separate bar charts by employee category, which is a separate question.
You can do this if you have "Vocalize"


By using field group + top box / bottom box metrics.
Thank you. Unfortunately the university does not have "Vocalize", but I appreciate your help.
Isn't it coming in automatically when you select "Breakdown by" and transpose the chart?
Oh yeah, they are not... 😞
In advanced reports you can add filters to individual widgets. Still on the "manual" side, but allows this to be doable.


Advanced Report Filters

Leave a Reply