MaxDiff Analysis | XM Community
Solved

MaxDiff Analysis

  • 3 August 2018
  • 3 replies
  • 101 views

Hi,

I created a Maxdiff question with 7 features, 5 sets of questions, 4 features in each sets. Each features is repeated 3 times expect 1 that is only repeated 1 time.

I have looked at the results - nice to see for each set the features that were the most and least choosen.

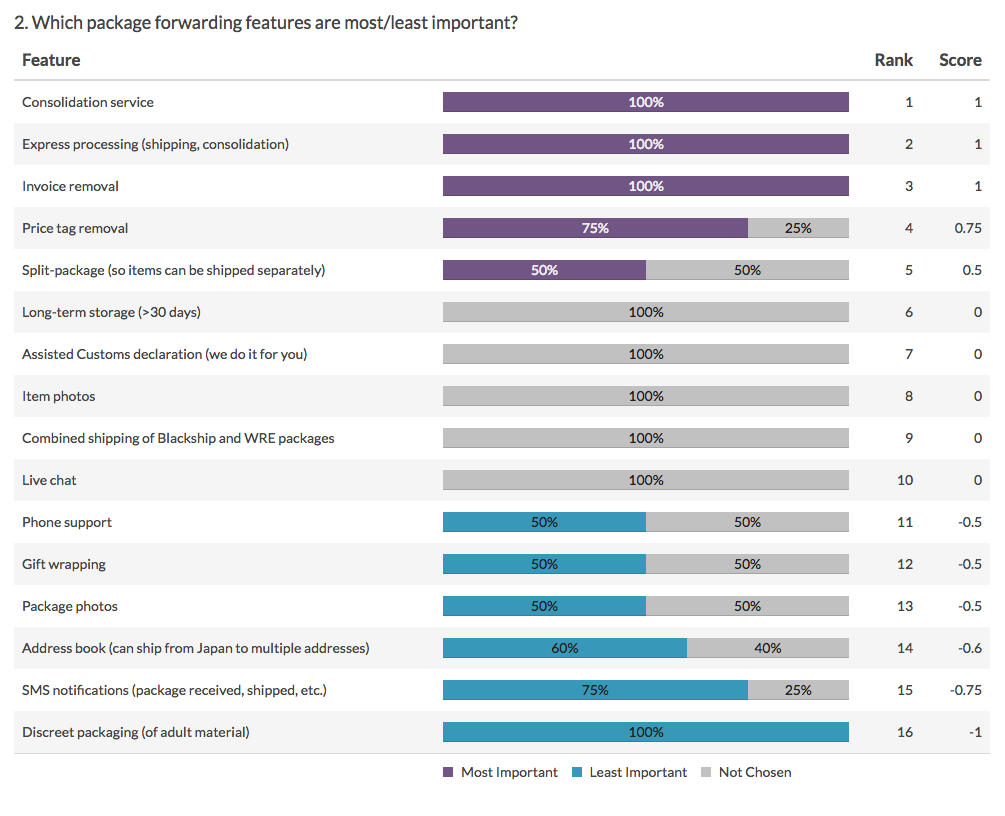
However I am trying to get more interpreation and vizualisation for this question. I would like to see a more general result - features that were the most and least chosen among all the participants in one graph - Is that possible?

Thank you!
icon

Best answer by Kate 6 August 2018, 19:01

View original

3 replies

Userlevel 7
Badge +33
In vocalize you can do this.

Go to custom matric and create matric with formula. This matric you can use in your graph.
Yeah it seems the MaxDiff "analysis" is totally half-baked. Not what we expected for this price!
surveygizmo generates maxdiff charts like this in their standard report
!
Userlevel 7
Badge +19
In the standard Research Platform- no. It's a simple calculation to create your own however:
[Number of time Select "most"]-[Number of times selected "least"]/[Number of times displayed]

Maybe Vocalize has something I'm unaware of, however.

Leave a Reply