Dear Qualtrics Community,
I am almost done running a survey using the Pick, Group, & Rank method to gather data. I'm a linguistics major at UW-Madison, and I would like to use the data from this survey method to view how participants grouped 10 Speakers together into four Dialect Group boxes (see the preview image below).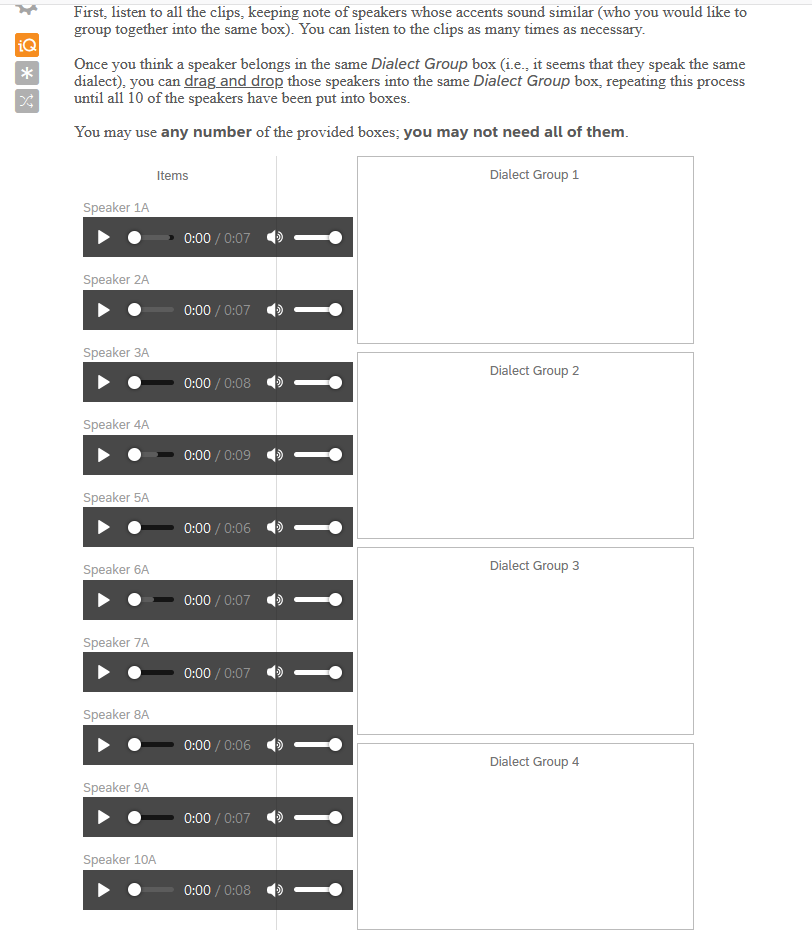
To that aim, my goal is to view how often participants grouped, say, Speaker 1 and Speaker 10 together into the same box versus Speaker 1 and Speaker 7, so on and so forth. However, what the Report outputs looks at rank (what Speakers people dragged in first to a box over others) and overall grouping (how often a Speaker was placed into a particular box [this does not help because different participants could have grouped the same two speakers together, but into any of the four different boxes]).
Is it possible to get the output that I'm looking for from all participants in the Report so I can run the graphs/etc.? If so, how? I have tried messing around with the columns and rows, but I keep running into the problem described above.
If not, I know that I can go to individual participant reports and manually count how they grouped each speaker (as shown below), but that is much more time consuming.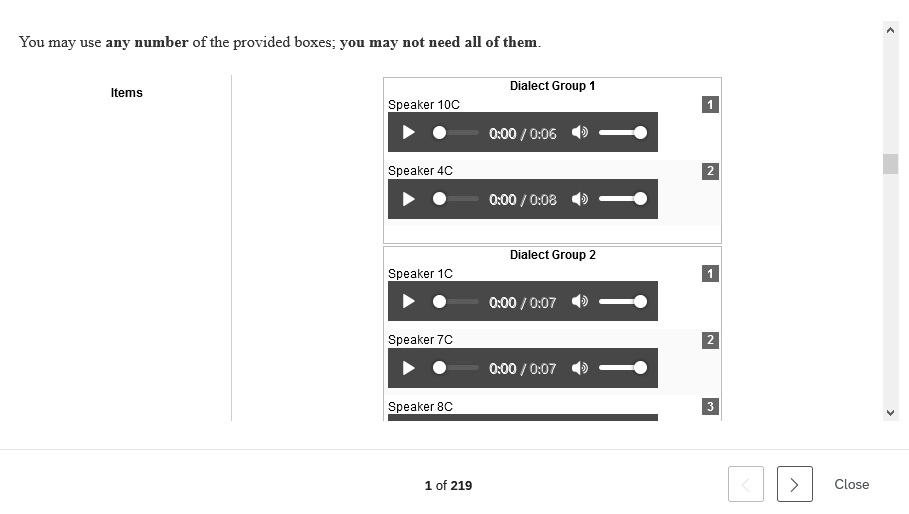

Pick, Group, & Rank Data Output Question: How to rework the report (to ignore Rank output)?
Best answer by LaurenK
Hi ArchLx! It looks like you were able to get in contact with our Support team about this, and the functionality you are looking for does not currently exist within the platform. If you have not yet already, we'd recommend posting this as a Product Idea so it may be considered as a future product enhancement!

Sign up
Already have an account? Login

Welcome! To join the Qualtrics Experience Community, log in with your existing Qualtrics credentials below.
Confirm your username, share a bit about yourself, then you're ready to explore and connect .
Free trial account? No problem. Log in with your trial credentials to join.
No free trial account? No problem! Register here
Already a member? Hi and welcome back! We're glad you're here 🙂
You will see the Qualtrics login page briefly before being taken to the Experience Community.
Login with Qualtrics
Welcome! To join the Qualtrics Experience Community, log in with your existing Qualtrics credentials below.
Confirm your username, share a bit about yourself, then you're ready to explore and connect .
Free trial account? No problem. Log in with your trial credentials to join. No free trial account? No problem! Register here
Already a member? Hi and welcome back! We're glad you're here 🙂
You will see the Qualtrics login page briefly before being taken to the Experience Community.
Login to the Community
No account yet? Create an account
Welcome! To join the Qualtrics Experience Community, log in with your existing Qualtrics credentials below.
Confirm your username, share a bit about yourself, then you're ready to explore and connect .
Free trial account? No problem. Log in with your trial credentials to join.
No free trial account? No problem! Register here
Already a member? Hi and welcome back! We're glad you're here 🙂
You will see the Qualtrics login page briefly before being taken to the Experience Community.
Login with Qualtrics
Welcome! To join the Qualtrics Experience Community, log in with your existing Qualtrics credentials below.
Confirm your username, share a bit about yourself, then you're ready to explore and connect .
Free trial account? No problem. Log in with your trial credentials to join. No free trial account? No problem! Register here
Already a member? Hi and welcome back! We're glad you're here 🙂
You will see the Qualtrics login page briefly before being taken to the Experience Community.
Enter your E-mail address. We'll send you an e-mail with instructions to reset your password.