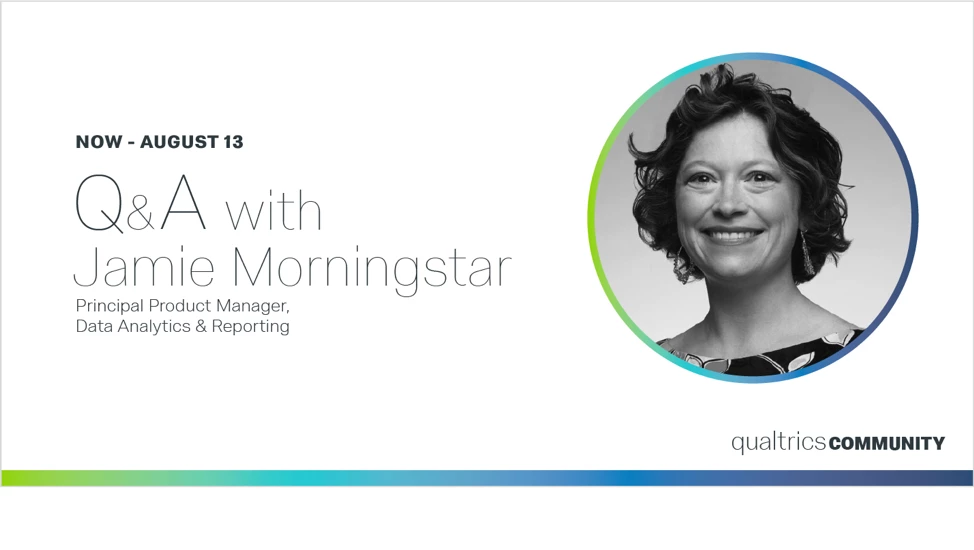
Starting now, you can ask questions of Product Manager Jamie Morningstar. Jamie covers a huge swath of our product, including Data Processing, Imports, Exports, Text Analysis, and Reporting (this includes both Results-Reports and Advanced-Reports). Wherever your survey data is involved, Jamie’s there, making things run as smoothly as possible.
Jamie was listed as one of Utah Business’ Forty under 40 and a finalist of the Women Tech Awards in 2017. Her goal is to make the way we interact with our data aesthetically pleasing, but also user-friendly so it gets us the answers we need. One of the features on her roadmap that she’s most passionate about is her revamp of the Text tab. Your ability to analyze text will soon be pumped up by all kinds of cool widgets and visualization tools, so stay tuned!
How This Works:
* If you have questions for Jamie, please post them here on this thread before August 13th. On that day, she will do her best to respond to every question she can.
* Please don’t ask support questions. If you need help with a technical issue, try posting a thread elsewhere in the community or contacting our Support Team.
* Please ask about relevant parts of the platform. For example, Jamie doesn’t design ticketing, but the manager in charge of that feature might do a Q&A someday!
* Have fun!


