I know nothing about JavaScript or coding but i want to get a graph similar to this one into qualtrics where the red distribution can be slid to the right of the black one. no numbers needed, just these two simple normal distributions. Can anyone help?
https://www.desmos.com/calculator/h2xsfakrik

Page 1 / 1
If you have the URL then you can include that URL in "iFrame" tag of HTML
https://www.w3schools.com/tags/tag_iframe.asp
And, if you planning to show the respondent data in the survey then, follow below thread
https://www.qualtrics.com/community/discussion/comment/6837#Comment_6837
https://www.w3schools.com/tags/tag_iframe.asp
And, if you planning to show the respondent data in the survey then, follow below thread
https://www.qualtrics.com/community/discussion/comment/6837#Comment_6837
!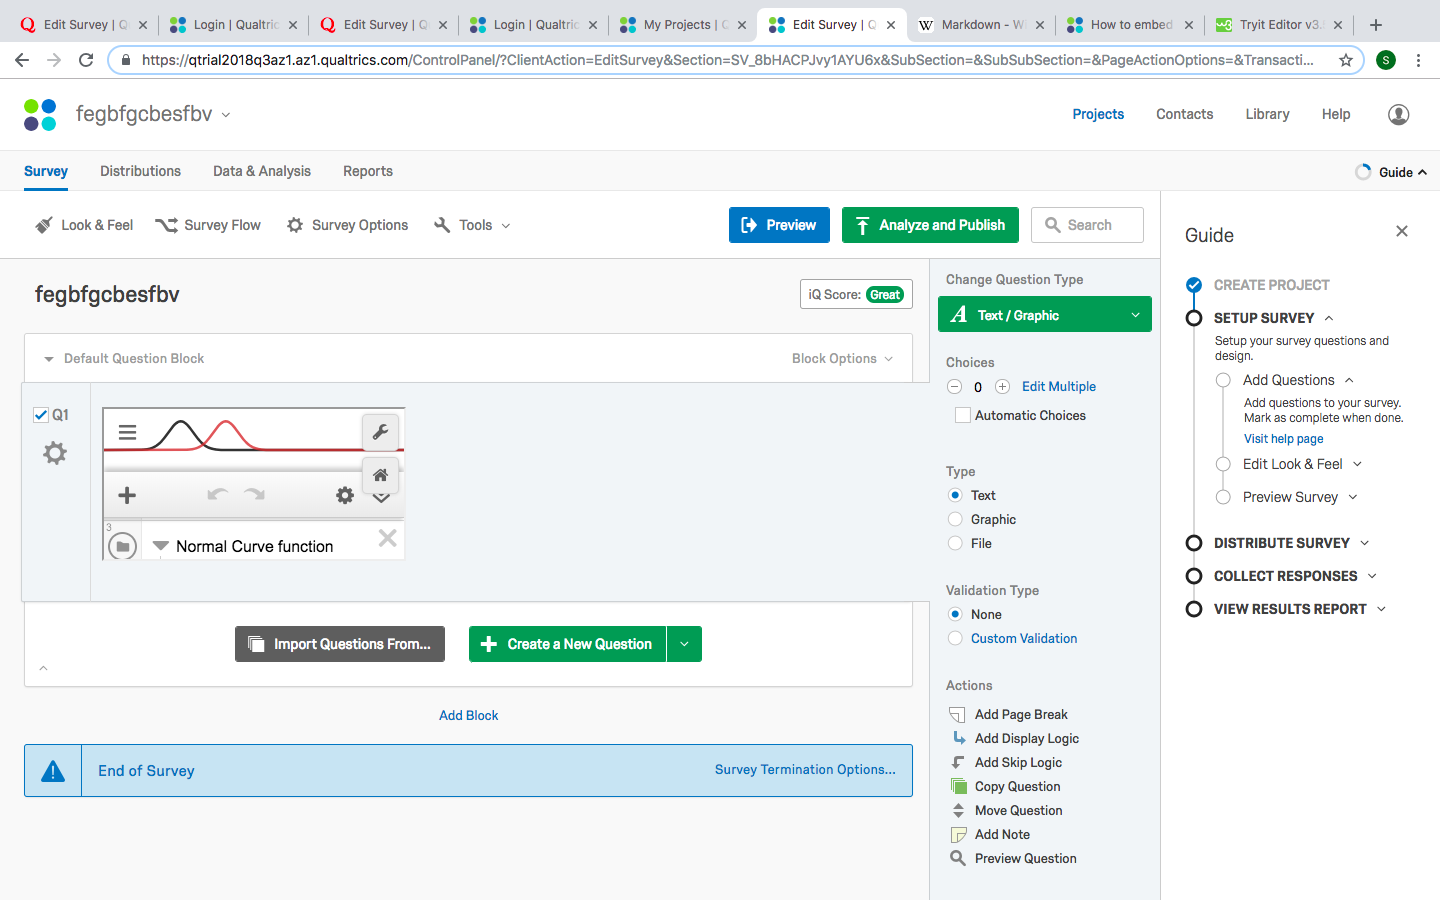
@Mohammedali_Rajapakar_Ugam I got it inserted as a question, but I want that as an answer, kind of similar to "slider questions" but using the distribution graph instead of the slider options that are already in qualtrics. sorry if my question was unclear!
@Mohammedali_Rajapakar_Ugam I got it inserted as a question, but I want that as an answer, kind of similar to "slider questions" but using the distribution graph instead of the slider options that are already in qualtrics. sorry if my question was unclear!
Enter your E-mail address. We'll send you an e-mail with instructions to reset your password.